


Why Must the US Housing Prices Plunge More Than 20%


2022 was a terrible year for most investors. It was one of those years when both bonds and stocks went down. However, there is one market where investors did relatively well — the US housing market. The S&P Case-Schiller Home Price index was up 6.5% through October. This is very strange, given that housing markets are typically sensitive to interest rates. However, while selling prices seem to be coming off their highs for the year, they were still higher than a year ago. Let’s take a look at S&P Case-Schiller Home Price Index in detail:
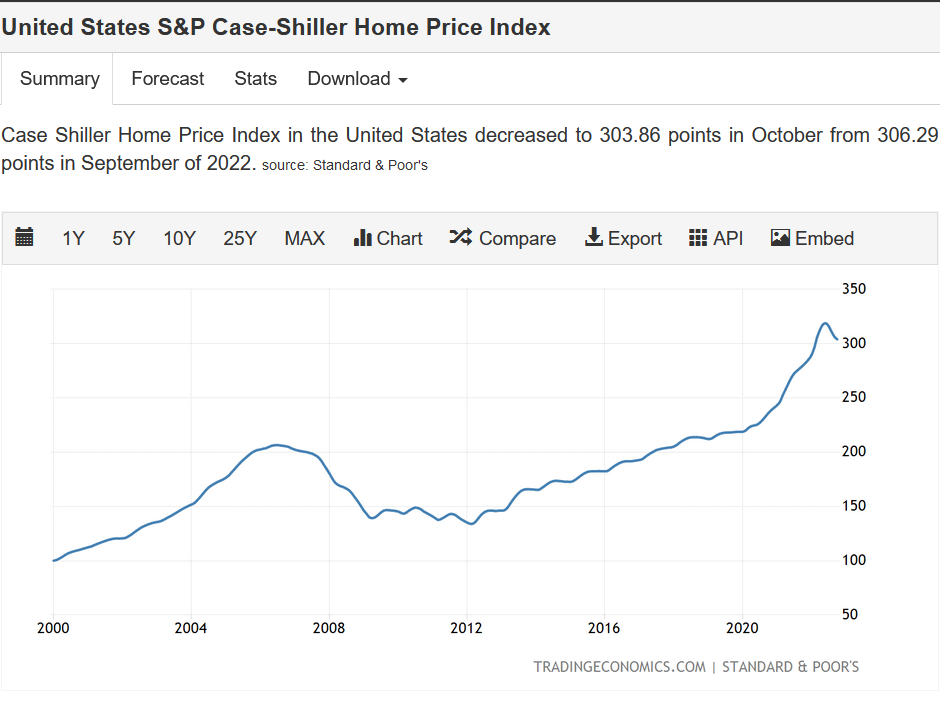
Taking the above into account, the best way to look at the housing market is to compare it to the CPI Index. House prices seem to have gone up substantially since 2020, due to the 15% inflation for that period. For this purpose we will split the historical data into two parts: — Jan 2003 to Jan 2020; and Jan 2020 to Oct 2022 (the last available data).
| Date | S&P Case- Schiller | CPI |
| Jan 2003 | 128.326 | 181.7 |
| Jan 2004 | 140.706 | 185.2 |
| Jan 2005 | 160.13 | 190.7 |
| Jan 2006 | 188.28 | 198.3 |
| Jan 2007 | 182.719 | 202.4 |
| Jan 2008 | 171.078 | 211.1 |
| Jan 2009 | 149.362 | 211.143 |
| Jan 2010 | 145.003 | 216.687 |
| Jan 2011 | 139.04 | 220.223 |
| Jan 2012 | 134.168 | 223.216 |
| Jan 2013 | 144.313 | 226.52 |
| Jan 2014 | 159.37 | 230.04 |
| Jan 2015 | 166.255 | 228.294 |
| Jan 2016 | 175.043 | 231.061 |
| Jan 2017 | 184.661 | 236.854 |
| Jan 2018 | 196.12 | 241.919 |
| Jan 2019 | 204.217 | 245.138 |
| Jan 2020 | 212.418 | 251.361 |
What happened since Jan 2020? From Jan 2003 to Jan 2020, CPI increased from 181.70 to 251.361 or 38.34%, while the S&P Case-Schiller Home Index rose from 128.326 to 212.418 or a 65.53% increase. Those numbers are not surprising — in most growing economies with growing populations, house prices tend to outperform inflation, and over these 17 years, the ‘beta’ of housing to CPI is 1.7. So, with every 10% inflation, we expect house prices to go up by 17%.
| S&P Case- Schiller | CPI | |
| Jan 2020 | 212.418 | 251.361 |
| Jan 2021 | 236.486 | 255.296 |
| Jan 2022 | 282.004 | 276.296 |
| Oct 2022 | 298.99 | 292.495 |
From Jan 2020 to Oct 2022, CPI increased from 251.361 to 292.495, or 16.36%. Using long-term beta, we would have expected the S&P Case-Schiller Index to be up 27% to 271.47. In actual fact, the S & P Case-Schiller Home Index increased from 212.418 to 298.99, or 40.75%! In this case, S&P Case-Schiller Index ‘outperformed’ its long-term beta to CPI by 14%.
So, is that performance justified? In our opinion, it is NOT:
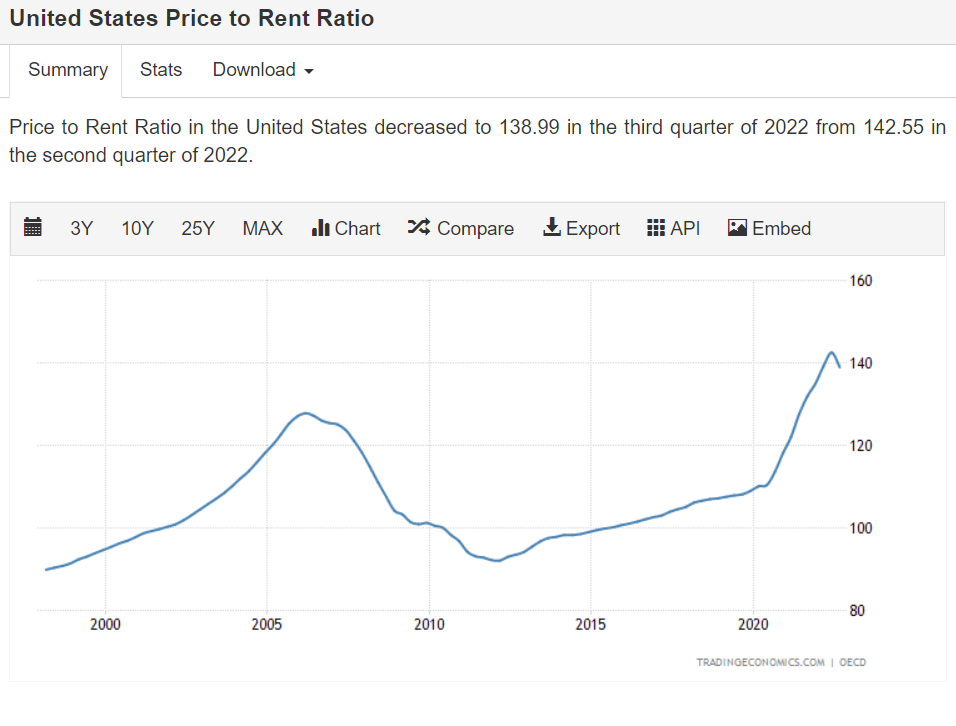
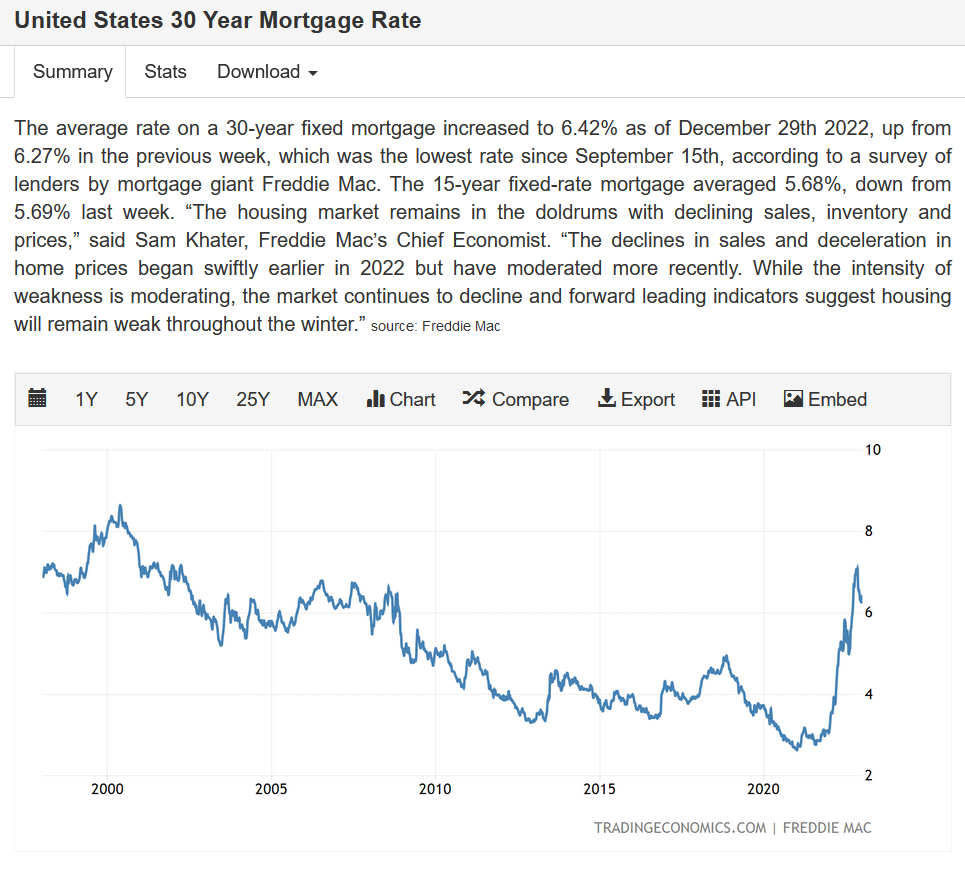
Relative to rental prices, house prices seem to be at a historical high, maybe around 15—20% away from their long-term average. Mortgage rates are also quite high!
The obvious question is — if house prices are so overpriced, why have they not fallen already? Well, let’s look at volumes of existing home sales:
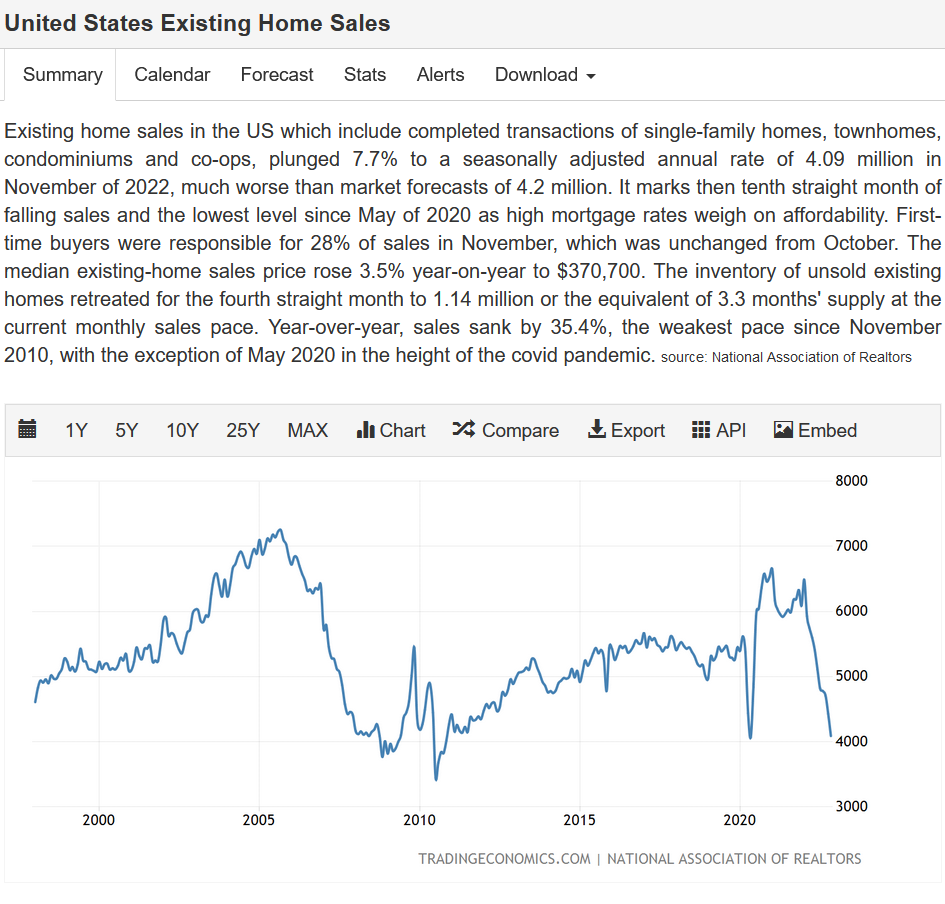
The answer, in our opinion at least, is clear — the housing market appears illiquid. Sellers are very slow to adjust prices lower, but the lack of volumes in existing home sales indicates that buyers are waiting for prices to go down.
That leaves one final question — could a significant increase in CPI (inflation of about 10% in 2023) bail out the housing market? Yes, possibly, but it’s highly unlikely. Take a look at M0 currently in circulation:
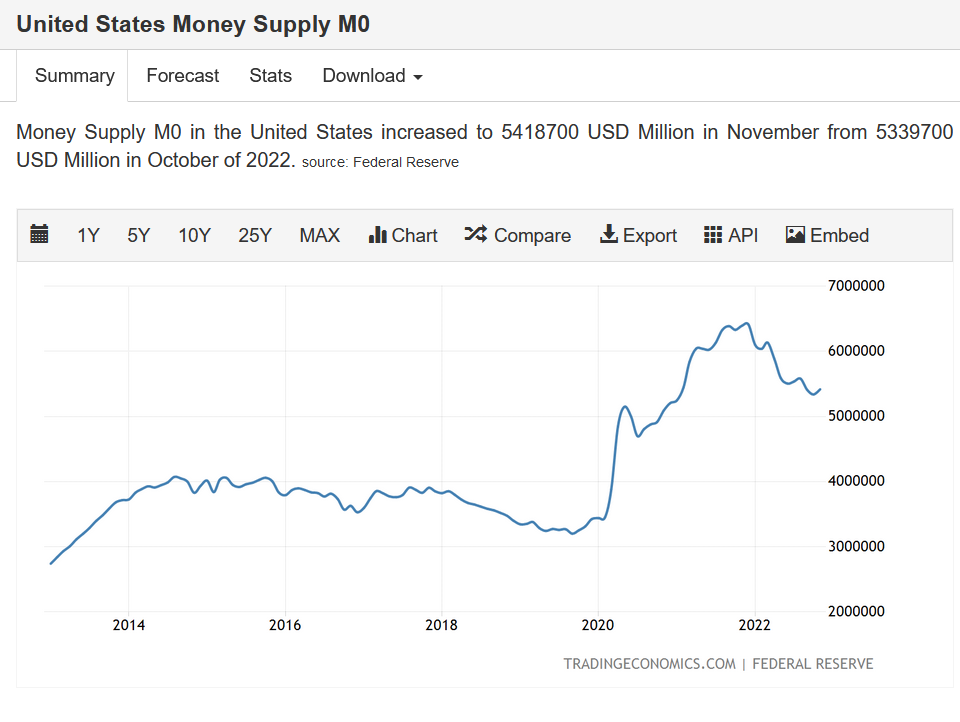
The Fed is serious about fighting inflation, raising interest rates, and reducing the Money Supply in the economy. It is doubtful that this restrictive policy will produce inflation near the 10% levels we saw in 2022.
In conclusion, the US housing market is currently at least 15—20% overpriced. Given that mortgage financing is at extremely high levels and monetary policy is very restrictive, we can expect a significant correction in housing prices in 2023. Prices may take more than a year to adjust to their fair value or drop by more than 20% in some areas. However, we expect weak housing prices to be a recurring theme in 2023.
Sources:
Trading Economic https://tradingeconomics.com/
Disclaimer: