
Start every trading day with a quick, actionable snapshot of global markets, key earnings, and the biggest movers across US, Europe, and Asia. Get the insight before your first coffee is gone.
November 9, 2023 | Issue 42
How to Use Leverage in Trading

Nikolay Stoykov
Managing Partner at Alaric Securities

Exploring the Ideal Market Portfolio
If you’ve explored economics or finance, you’ve likely encountered the CAPM (Capital Asset Pricing Model), a pivotal concept often discussed in the realm of leverage in trading.
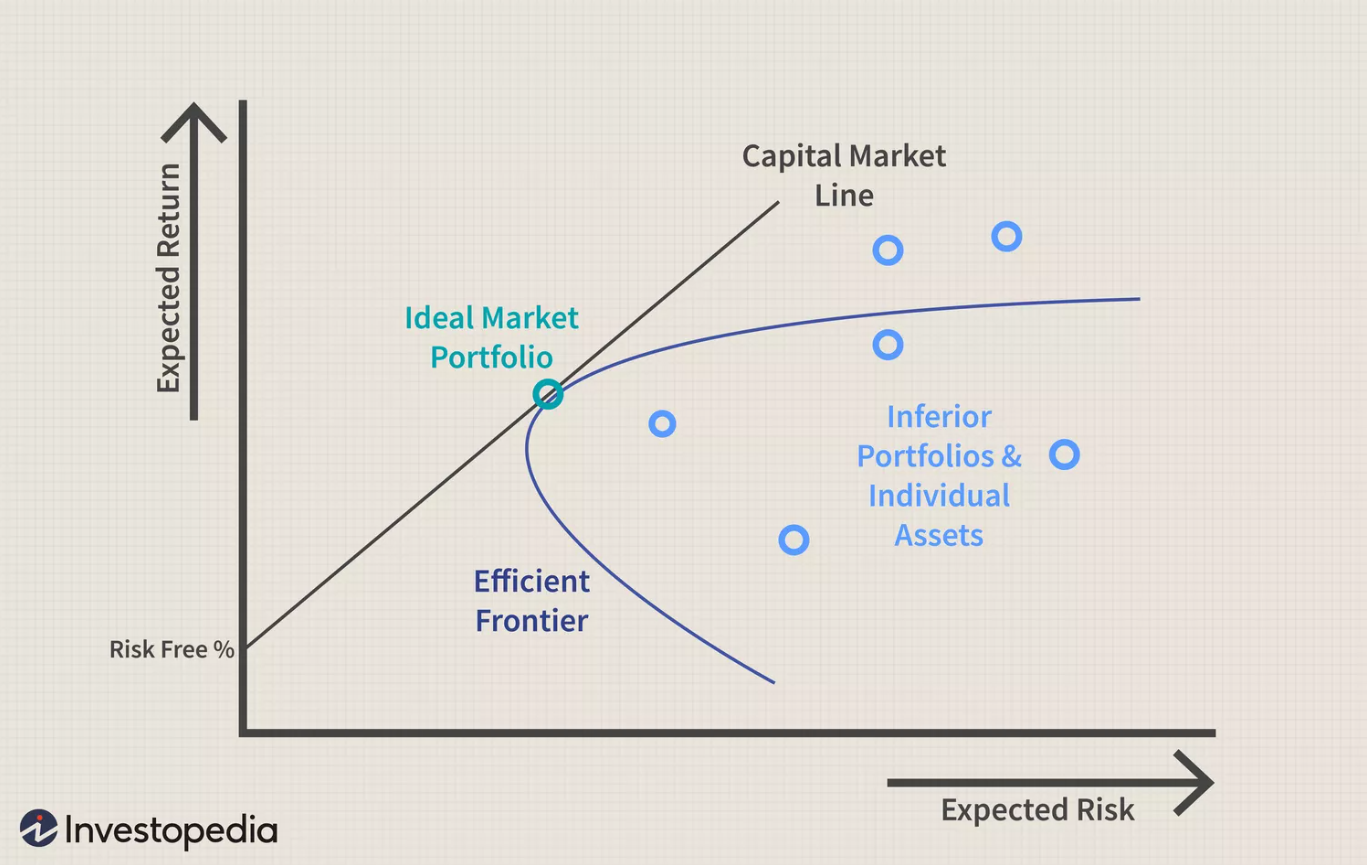
The essence of the CAPM is that the Capital Market Line is the Efficient Frontier –the portfolios that maximize expected returns over expected risk. Any portfolios below the Capital Market Line are inefficient (expected return relative to expected risk is not optimal).
Portfolios along the Capital Market Line to the left of the Ideal Market Portfolio combine government bonds and the Ideal Market Portfolio (Index Fund). Portfolios along the Capital Market Line but to the right of the Ideal Market Portfolio are using leverage to get more than 100% exposure to the Ideal Market Portfolio.
One of the assumptions of CAPM is that markets are perfectly efficient. You can buy and sell at the same price, pay and receive interest at the same rate, there are no trading fees, and markets are always open. None of the assumptions mentioned above are 100% true. There is always a bid-asked spread, long and short interest rates differ, fees are associated with trading, and most other markets are not open 24/7 outside crypto markets.
While the assumptions for efficient markets are not 100% true, the implications for portfolios to the left of the Ideal Market Portfolios are not great. However, the implications for portfolios to the right of the Ideal Market Portfolio COULD be pretty dramatic. Some of the risks associated with those market imperfections are:
- Cost of leverage may increase over time versus initial estimates
- Additional capital might be necessary if margin requirements increase (they fluctuate daily)
- Leverage may not be always available
Illustrative Portfolios: Leverage in Trading for Optimal Performance
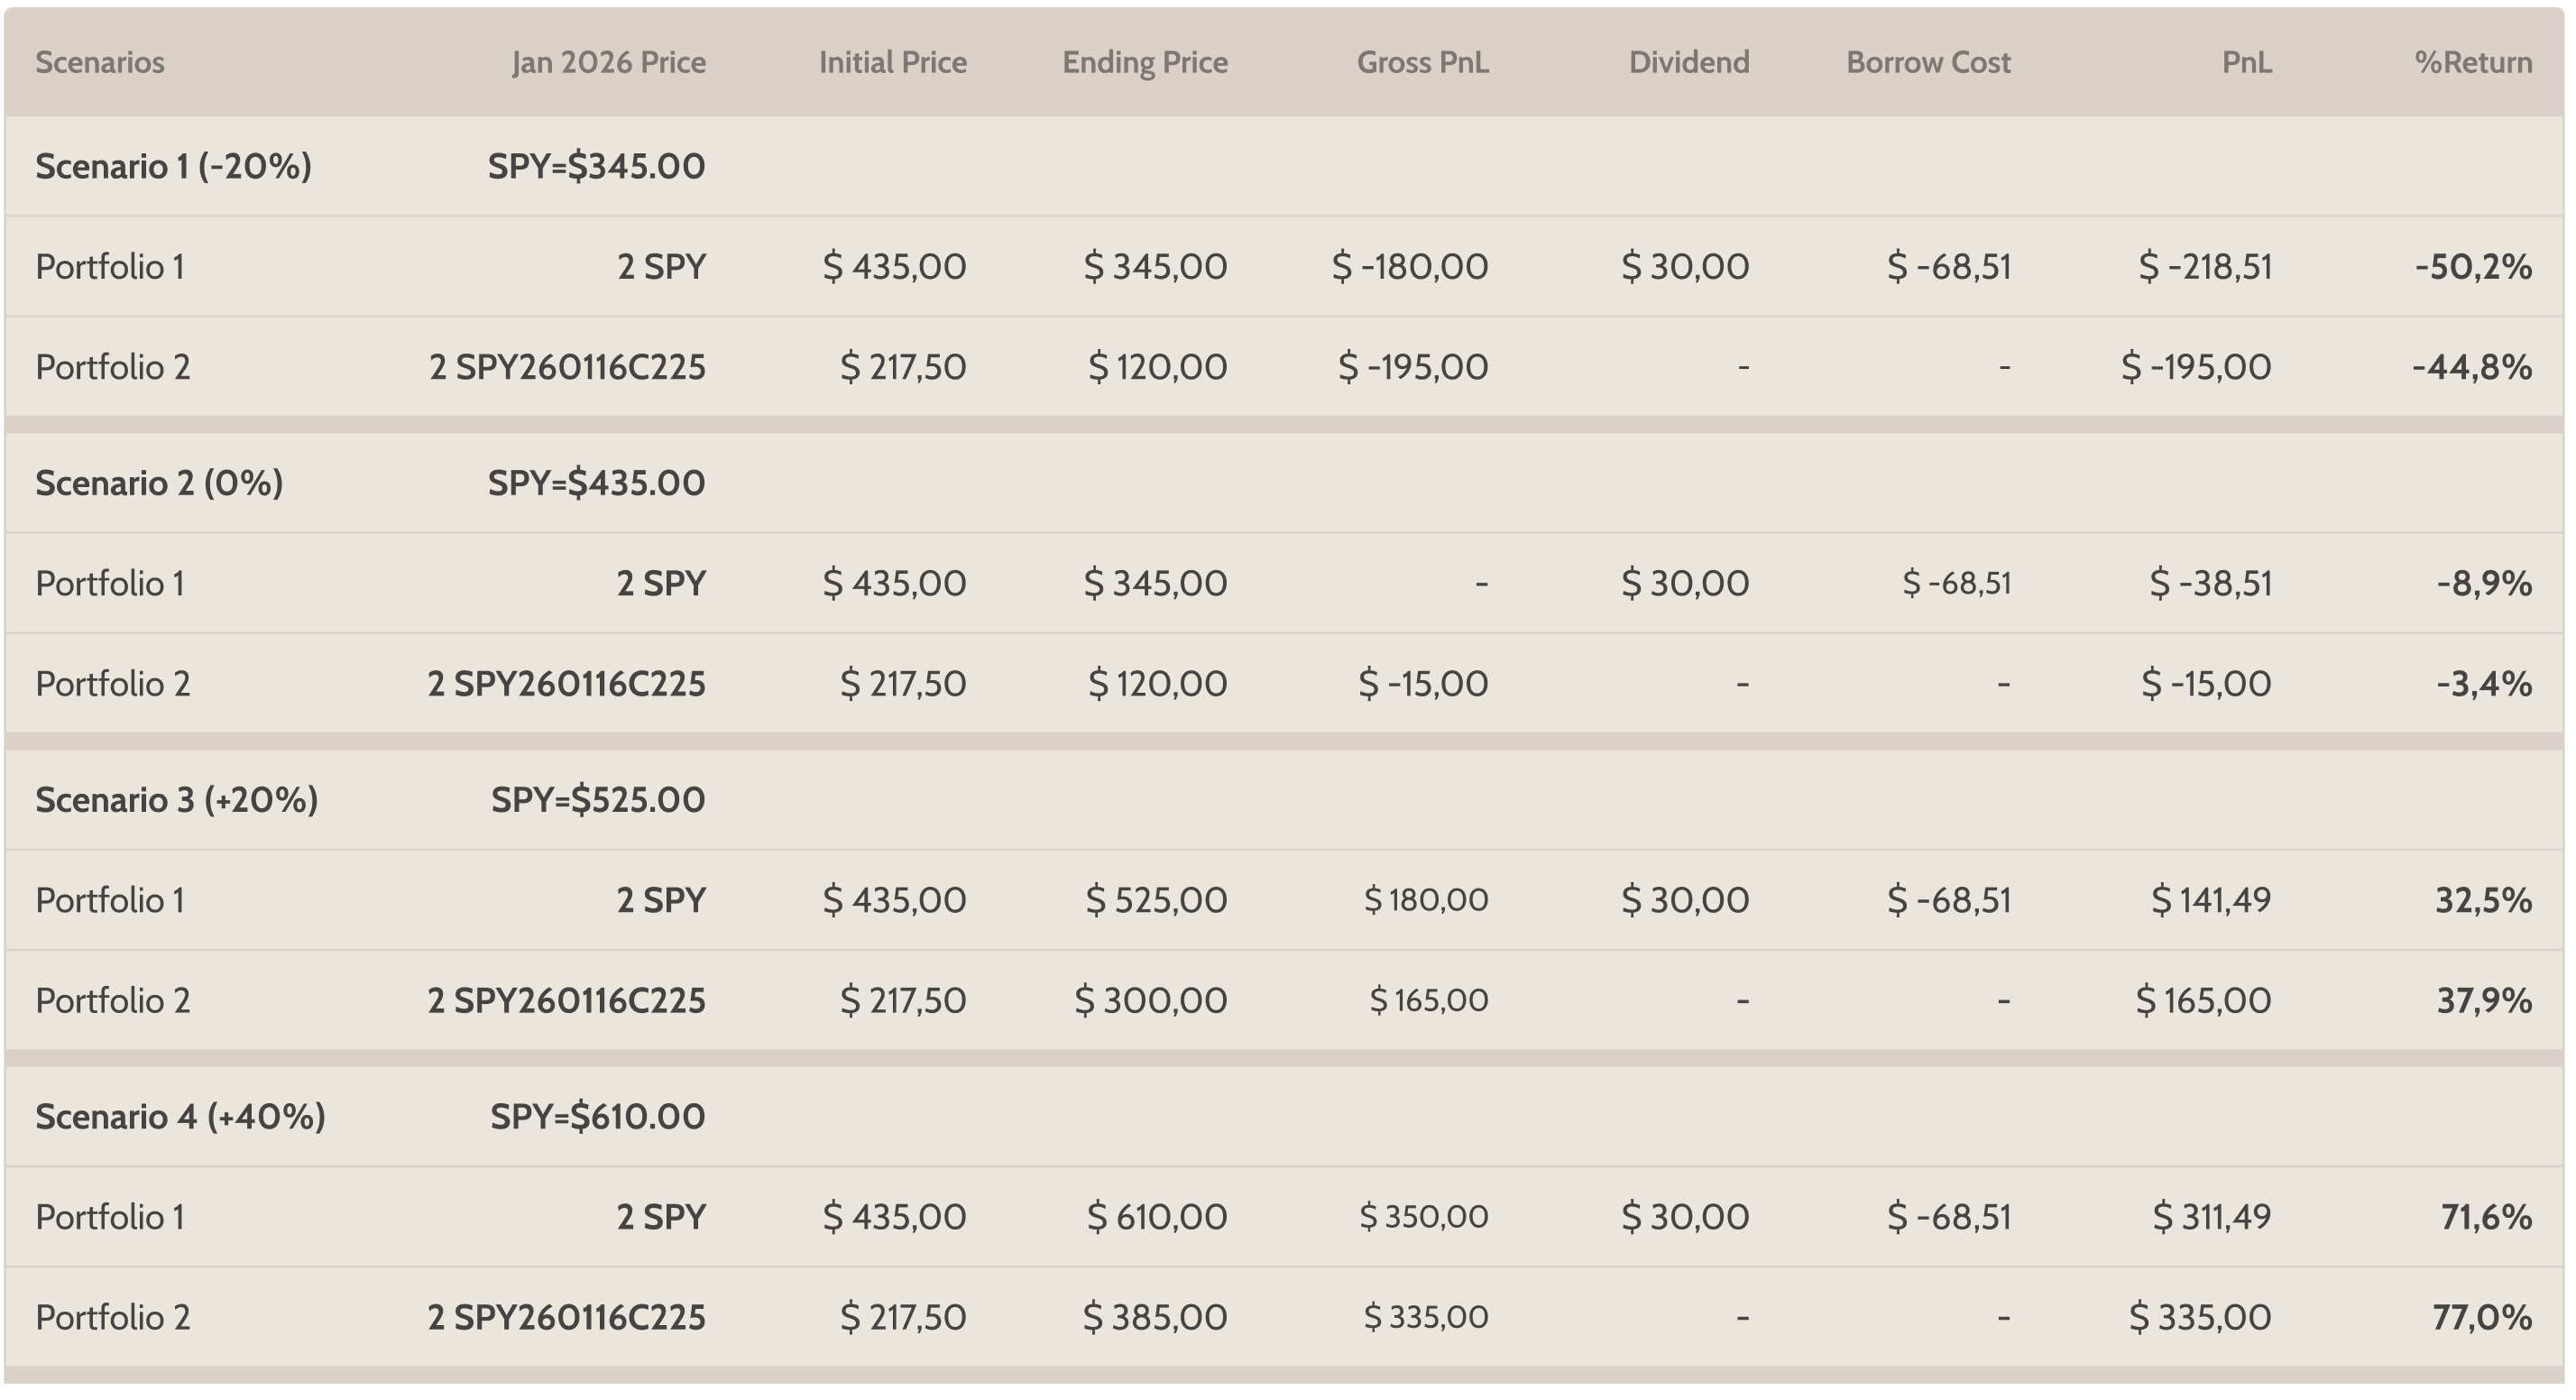
Given the risks mentioned above, portfolios along the Capital Market Line to the right of the Ideal Market Portfolio are quite more difficult to construct. Our practice shows that the best way to do so is to use deep In-The-Money call options. Let’s give you an example of 2 portfolios that use 100% leverage, using current market conditions:
Ending Period: January 2026 (2.25 years)
Average SOFR rate for the period until January 2026 = 5%
Average Borrow Rate = 7% (+200bps over SOFR)
Cash: $435.00
SPY = $435.00
Portfolio 1: Long 2 SPY, the portfolio has a market value of $870.00 and borrows $435.00 (2:1 leverage)
Portfolio 2: Long 2 SPY Jan 2026 225 Call, ticker is SPY260116C225. Consequently, the call options are trading at $217.50; the portfolio has a market exposure of $870.00 but a market value of $435.00 and does not need leverage.
1 SPY Dividend for the period = $15.00 (or $30.00 for 2 SPY, no withholding or tax rate)
Cost of Borrow @ 7% until January 2026 for $435.00 = $68.51
Strategic Insights for Market-Leading Portfolios
In the scenarios above, our readers can see that Portfolio 2 consistently performs better . Additionally, Portfolio 2 outperforms Portfolio 1, showcasing its efficiency. The reason is primarily that the interest rates currently implied in the SPY Jan 2026 options are closer to the SOFR rate. As such, leveraged portfolios constructed using deep In-The-Money call options tend to have cheaper borrow rates, are not subject to margin fluctuations, and never need additional capital.
The downside is that dividend rates could dramatically increase, or expected borrowing rates could decrease significantly. However, even those limitations are largely mitigated by the fact that the portfolio will never need additional capital, no matter what the market does.
The example above uses prices for SPY ETF and its listed options. However, we have done similar portfolios for ETFs like QQQ, IWM, XLE, and EEM. We have also used the same strategy to leverage portfolios on liquid stocks like AAPL, MSFT, and GOOG. All necessary is relatively liquid, long-dated options in the underlying instrument.
Disclaimer
The articles, podcasts, and newsletters from Alaric Securities OOD solely represent the authors’ views affiliated with the company. They do not represent the perspectives of Alaric Securities OOD or any of its subsidiaries or affiliates. They are provided for informative purposes and do not constitute recommendations for or against purchasing or selling security. Digital assets (such as cryptocurrency) or other assets in any account. They are neither research reports nor meant to be the foundation for any investing decisions. Any third-party information given does not represent the views of Alaric Securities OOD or any of its subsidiaries or affiliates. All investments carry risk, including the potential loss of principal, and past success does not assure future success.
Stay Ahead with Alaric Securities Newsletters
Traders and investors don't need more information - they need better information. That’s what we deliver!
Step back from the daily noise. Each issue explores market trends, industry shifts, trading opportunities, and exclusive updates — learn what's shaping the markets, not just what's trending online. Ready to get the edge?