Charts are the workhorse and one of the main features of HAMMER PRO™.
Efficient implementation – allows you to easily run dozens or more real-time charts at the same time on an average PC. The number of concurrently open charts is only limited by your CPU and memory.
Fully configurable charts – ribbon/toolbars, colors, indicators, and various other features that can be shown. You can adjust the periods, frequency, timeframes, indicators and annotations colors.
Drawing tools on the charts – You may create templates, configuring a chart exactly the way you like, with the chart type, correct period, frequency and indicators that you require, and store this configuration to use it later.
Tracing – it means having a moving cross-hair on the chart that allows you to find out exact values of candles and indicators at a particular point. When Trace Panel is shown, it can be moved by dragging it inside the chart to a different preferred location.
Time-based Chart Types
(with continuous bottom time axis)
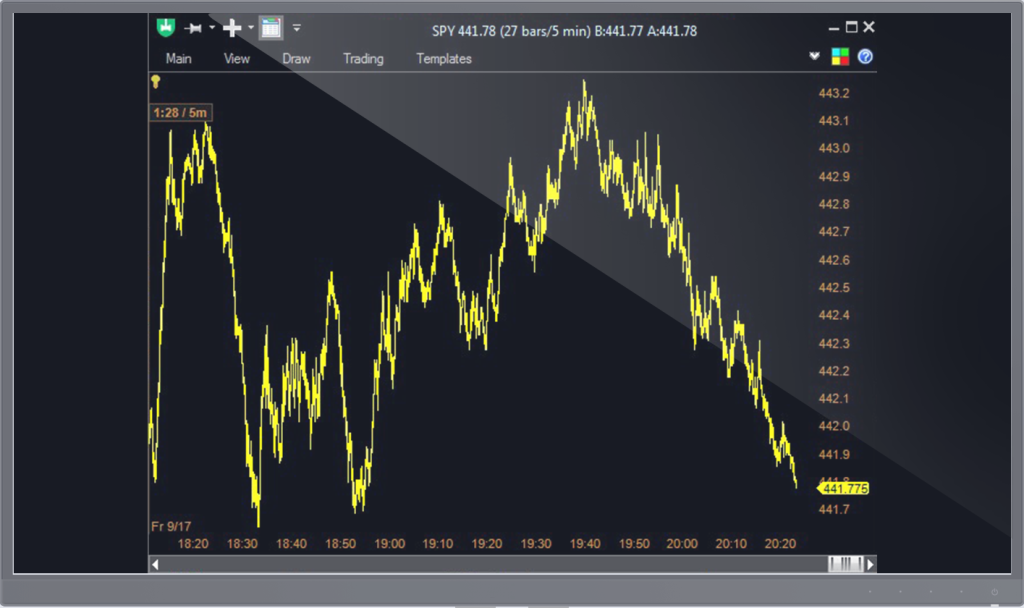
Line – a line graph that shows the Close value for every time period.
Line Tick – a line graph that shows every tick for the symbol – that is, every time a trade occurs, a new point on the graph is added.
Candle – each candle shows the Open, High, Low and Close values for a time period.
OHLC – each bar shows the Open, High, Low and Close values for a time period.
“Line Tick” example
“Renko” example
Non-Time-Based Chart Types
(with discrete bottom time axis)
Tick Candle and Tick OHLC – each candle or bar shows the Open, High, Low and Close for a certain number of ticks – that is, trades.
Volume Candle and Volume OHLC – each candle or bar shows the Open, High, Low and Close for a certain volume of shares traded.
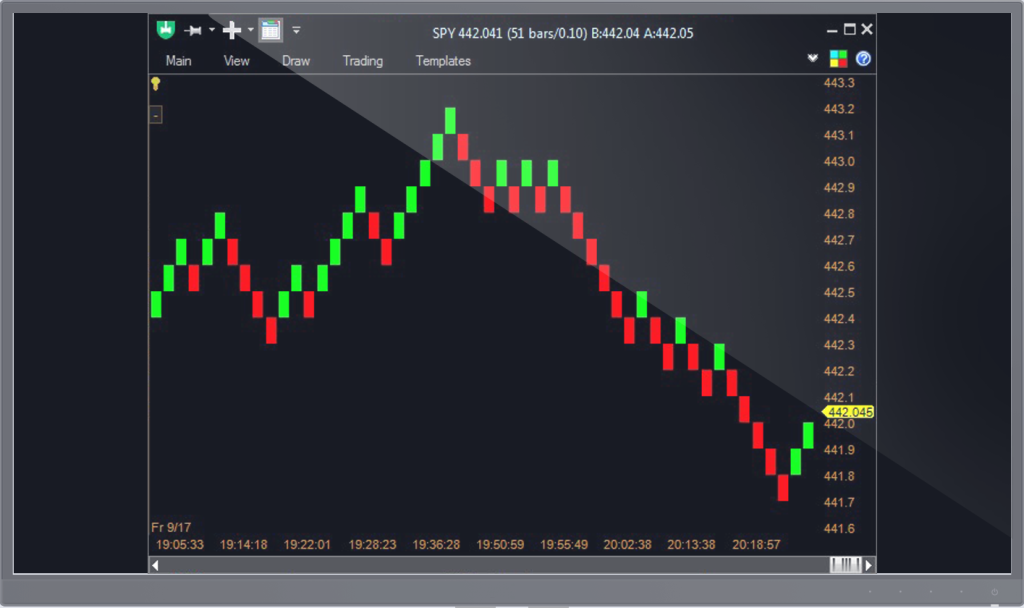
Range Candle and Range OHLC – each candle or bar shows the Open, High, Low and Close for a certain range of price movement.
Renko – chart type popular in Japan that attempts to filter out small price movements.
For all Candle or OHLC charts,
the following modifications are possible:
Heiken Ashi – uses the open-close data from the prior period and the open-high-low-close data from the current period to create a combo candlestick.
Staircase – Removes the gaps between candles by making the Close of the candle always equal to the next candle’s open.
For historical charts,
the following modification is available:
Logarithmic Scale – can be applied to all chart types, changes how the Y scale is calculated and displayed.
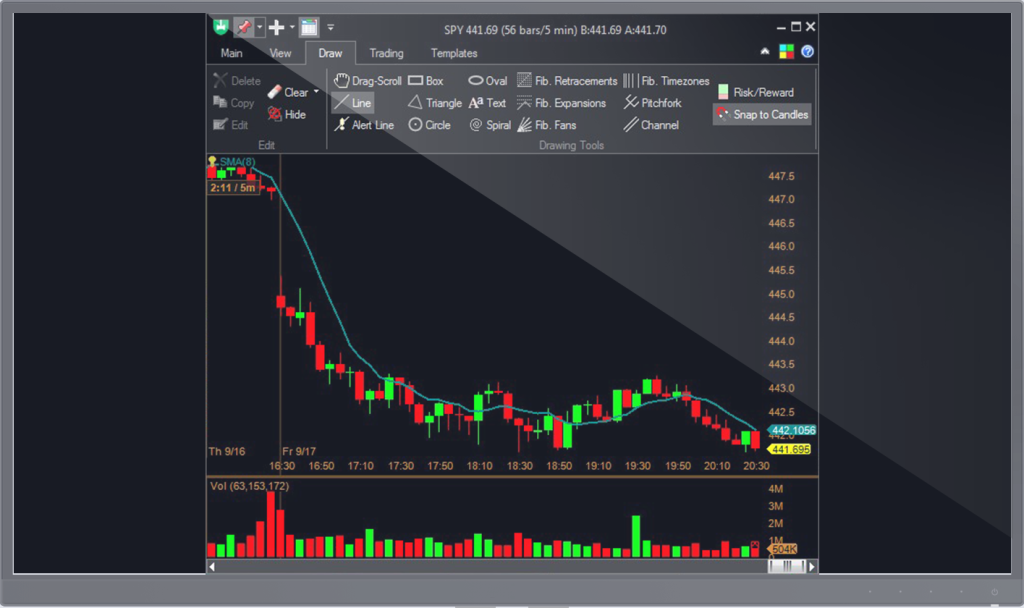
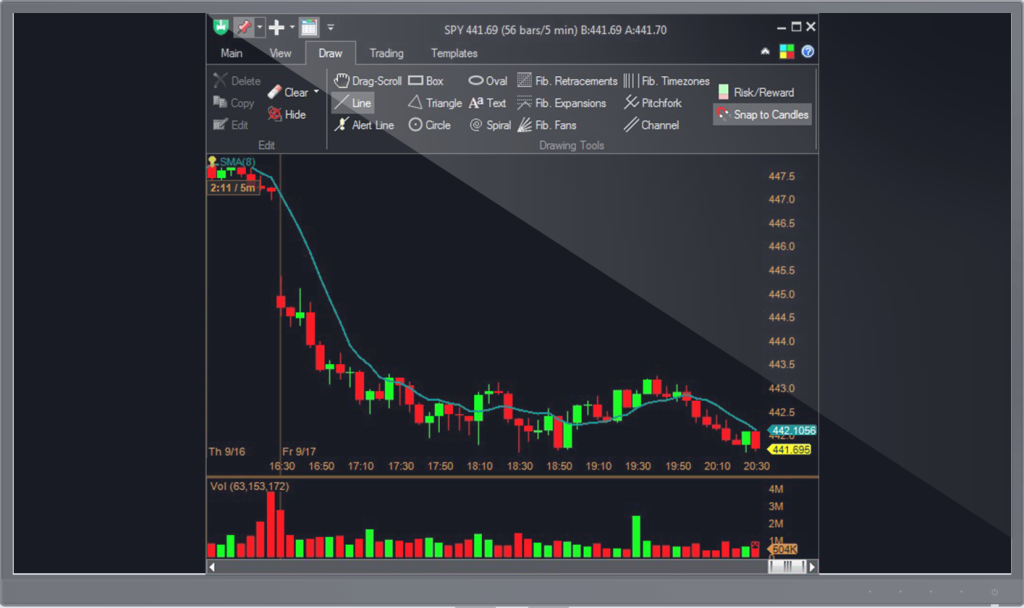
Annotations
You can add annotations to the charts – lines, shapes, text, etc. Once the annotation is placed on the chart, it can be moved or modified:
Change the colors
Line thickness
Parameters
Edit
Draw
Delete
Copy, etc.
There is an Annotations Unique Per Chart setting – this controls whether the annotations you draw are shared between several same-symbol charts or only shown on the chart on which you drew it.
Fibonacci Retracements
Drawing a Fibonacci Retracement on the chart, you can make it automatically place itself on the high/low of the visible portion of the chart.
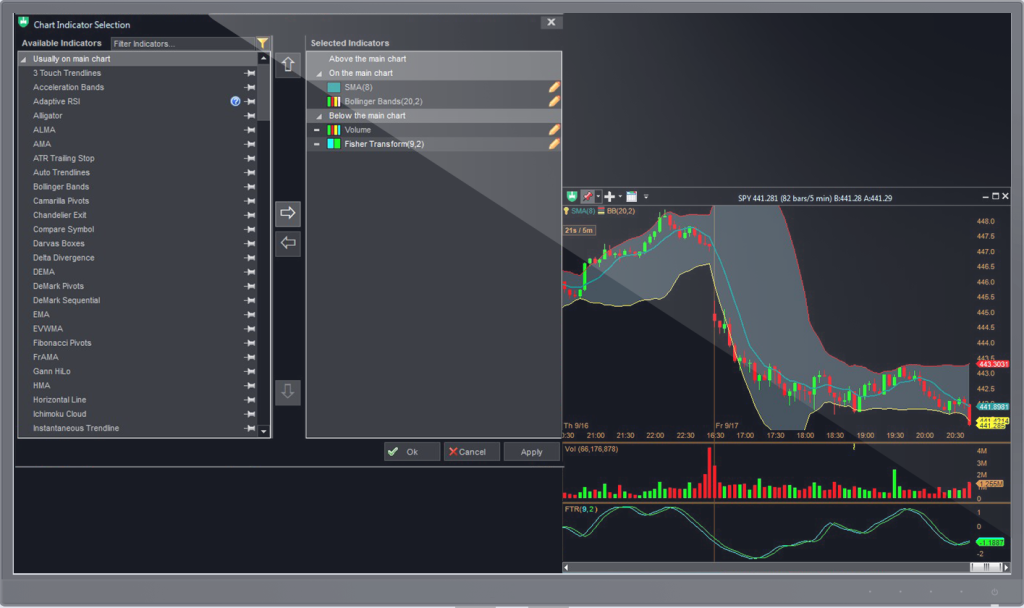
Indicators
You can add various indicators on the charts and link them together: