

This ETF has jumped sevenfold since the start of the bull market
Since the start of the bull market in March 2009, Wall Street stocks have nearly quadrupled, with the major indexes currently trading near record levels. A tiny small-cap value fund, however, has more than doubled that advance.
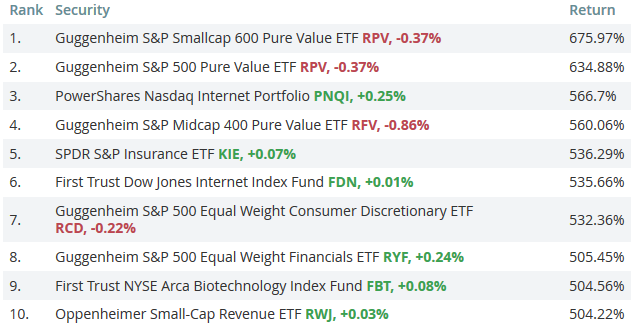
The Guggenheim S&P Smallcap 600 Pure Value exchange-traded fund RPV, -0.37% is the top-performing ETF since the S&P 500’s SPX, +0.13% postfinancial crisis bottom, beating out the other 562 nonleveraged exchange-traded products that were in operation at the time and which continue to trade today. It has soared 675.97% since that period, compared with the 281.87% rise of the SPDR S&P 500 ETF Trust SPY, +0.16% which tracks the broader market over what has been the second-largest bull market on record.
The data was provided by Morningstar and was calculated from March 10, 2009 through Nov. 25, 2016.
The relatively small fund—it only has $232.7 million in assets, according to FactSet, and it trades under 40,000 shares a day, on average—focuses on small and microcap stocks, while its value tilt gives it a lower price-to-book ratio than other ETFs tracking small-cap indexes. Another Guggenheim value fund, the Guggenheim S&P 500 Pure Value ETF RPV, -0.37% is the second-best performer, boasting a 634.88% since the 2009 bottom.
The gain of the S&P 500 ETF places it as the 180th best performer of the 563, putting it in the top third of funds. That a heavy majority underperformed the benchmark speaks to one of the biggest investing trends of the past seven years: the growing adoption of passive investing. Research has shown that very few active or “smart beta” funds can beat the broader market over the long term.
Among other widely-followed funds, the iShares Core U.S. Aggregate Bond ETF AGG, +0.11% is up 35.31% since the stock market bottom (454th best), the iShares iBoxx $ Investment Grade Corporate Bond ETF LQD, +0.14% has gained 74.4% (405th best), and the iShares iBoxx $ High Yield Corporate Bond ETF HYG, -0.13% is up 128.19% (334th best). The SPDR Gold Trust GLD, -0.47% is up 24.68% over the period (471st best) while the Vanguard FTSE Emerging Markets ETF VWO, +0.06% has gained 116.78% (354th best).
In a sign of how broadly the economy has recovered, 510 funds—or 90.5%—are at least somewhat positive since the market bottom, not including fees. The smallest gainer of the applicable universe, the SPDR Bloomberg Barclays Short Term International Treasury Bond ETF BWZ, +0.47% is up a mere 0.3% over the period. The narrowest loser, the SPDR Bloomberg Barclays 1-3 Month T-Bill ETF BIL, +0.00% is down 0.2%, for an annualized loss of 0.04%.
In addition to the Guggenheim funds, specific sectors also numbered among the top 10 ETFs. Two internet funds charted, underlining the explosion in technology usage and businesses over the past seven years. Since the market bottom, major companies like Facebook Inc. FB, +0.38% and Twitter Inc. TWTR, -0.60% have gone public, while names like Netflix Inc. NFLX, +0.50% have become major businesses.
Here are the 10 best-performing funds since the market bottom:
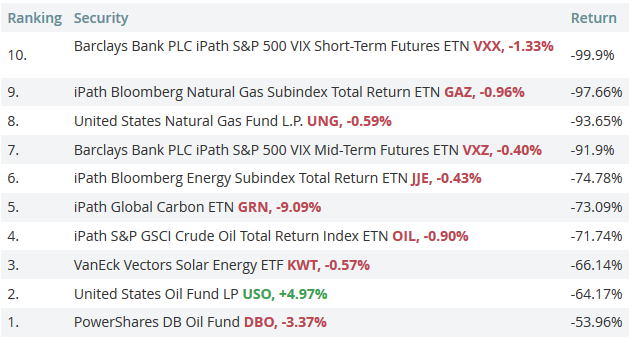
Because the bull market has been essentially uninterrupted since it began—with only a few market corrections, all of which were short-lived—two of the 10 biggest losers since the bottom have been volatility-related products, which have an inverse correlation to the broader market. The CBOE Volatility index VIX, -3.88% which these securities are built around, it is often referred to as the “fear index,” an emotion that hasn’t been evident in markets over the past several years.
The other big losers of the bull market has been commodity-related funds, which reflects the massive upheavals in the space. A variety of energy-related funds—including those that cover crude oil, natural gas, and solar power—make up the rest of the biggest decliners. As natural gas and solar technologies have matured, their costs have dropped precipitously, which has weighed on the profitability of those sectors. Meanwhile crude oil has also seen sharp drops amid waning demand—an issue due to global growth levels as well as competition from other energy sources—and oversupply issues that continue to this day.
Here are the top 10 biggest losers:
When leveraged funds are included, the absolute best-performing fund since the market bottom is the Direxion Daily Mid Cap Bull 3x Shares ETF MIDU, +0.58% which aims to return three times the daily return of its underlying index. That fund soared 3,327.66% over the period, meaning every $10,000 invested turned into $342,766, not including taxes or fees. One caveat: leveraged funds like MIDU are designed to be short-term holdings; because they offer leveraged exposure to a daily move, buying and holding such funds generate a different return than using them intraday.
The worst-performing ETF of the entire universe that has existed since the bottom is the Direxion Daily Financial Bear 3x Shares fund FAZ, -0.84% another leveraged product. It is down 99.97% over the applicable period; a trader who invested $10,000 into the fund on the day of the bottom would currently have $3.
Article and media originally posted by Ryan Vlastelica at marketwatch.com