
Start every trading day with a quick, actionable snapshot of global markets, key earnings, and the biggest movers across US, Europe, and Asia. Get the insight before your first coffee is gone.
July 22, 2026 | 165
US Treasuries: Mid-Year 2026 Update

Nikolay Stoykov
Managing Partner at Alaric Securities

We’ve written before about our positive stance on US Treasuries, most recently in our May 20 blog, “US Bond Market Outlook May 2026.” Clients and colleagues keep asking whether that view has changed. So we took another, deeper look.
Quick answer: As of this update, the spread between the 10-year Treasury yield and the 10-year breakeven inflation rate sits at 2.33%, a z-score of 1.54 above its 10-year average — close to the historical extreme, but more likely to revert than to break new ground.
We remain bullish on US Treasuries. Here’s why.
US Treasuries: Breakeven Rates vs. 10-Year Yields
Below is 10 years of history comparing the 10-year breakeven inflation rate with the 10-year US Treasury rate, courtesy of FRED (Federal Reserve Economic Data).
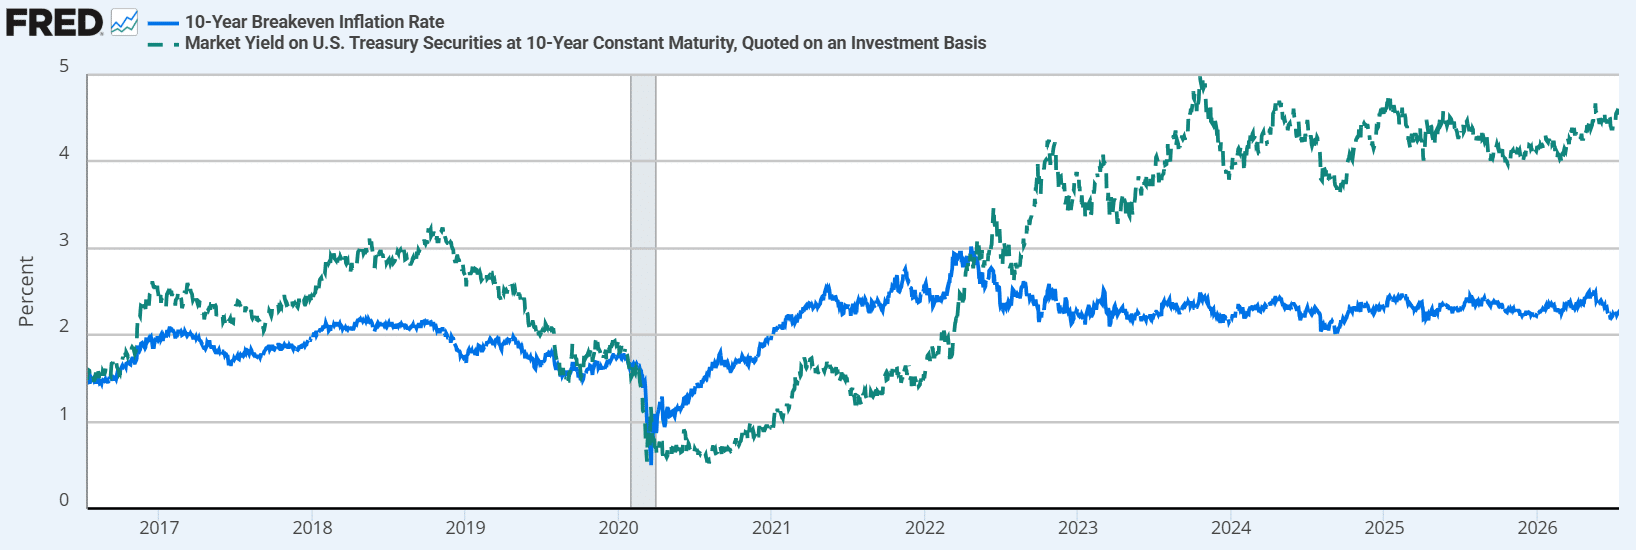
The comparison rests on a simple idea: the 10-year breakeven inflation rate is widely regarded as the market’s best estimate of average inflation over the next decade. If that holds, US Treasury yields and breakeven rates should move together, and the spread between them should stay within a fairly stable historical range.
The data backs this up. The two series have a correlation of 0.59 — not exceptionally high, but moderately strong.
The spread, by the numbers:
- 10-year average breakeven rate: 2.10%
- 10-year average Treasury yield: 2.83%
- Average spread: 0.73%
- Standard deviation of the spread: 1.04%
- Historical range: -1.19% (August 2021) to +2.52% (October 2023)
Where we stand today:
- Current 10-year breakeven rate: 2.25%
- Current 10-year Treasury yield: 4.58%
- Current spread: 2.33%
Importantly, inflation expectations themselves are close to their historical average. The unusually high nominal yield is being driven primarily by unusually high real interest rates, not runaway inflation expectations. That puts the current spread at a z-score of 1.54 — 1.54 standard deviations above its historical average, and just 0.19% away from the 10-year extreme.
Using the last 10 years as a reference point, today’s reading sits very close to the upper bound of the historical distribution. That makes a reversion toward the mean far more likely than a push into new extreme territory.
Why US Treasuries Are Unlikely to Hit a New 10-Year Extreme
The Fed’s Dual Mandate Problem
There’s significantly more debt in the world — and in the US specifically — than there was a decade ago. The Federal Reserve is mandated to fight inflation and maintain full employment. Letting real 10-year interest rates climb to fresh 10-year highs would carry real consequences for the US economy and labor market.
The Fed is serious about fighting inflation, but persistently higher real rates would also meaningfully increase federal interest costs while tightening financial conditions for households and businesses. That’s a lot of pressure working against a new extreme.
Coupon-Adjusted Returns Tell a Different Story
Most investors judge long-term Treasuries by the performance of the TLT ETF (25+ year Treasury ETF). But TLT’s price chart doesn’t include the interest paid out in monthly coupons.
A better proxy for total return is the U10C ETF (Amundi US Treasury Long Dated Accumulating ETF), which automatically reinvests its coupon payments — worth noting it also carries a 10% withholding tax. Here’s how the two compare, courtesy of TradingView:
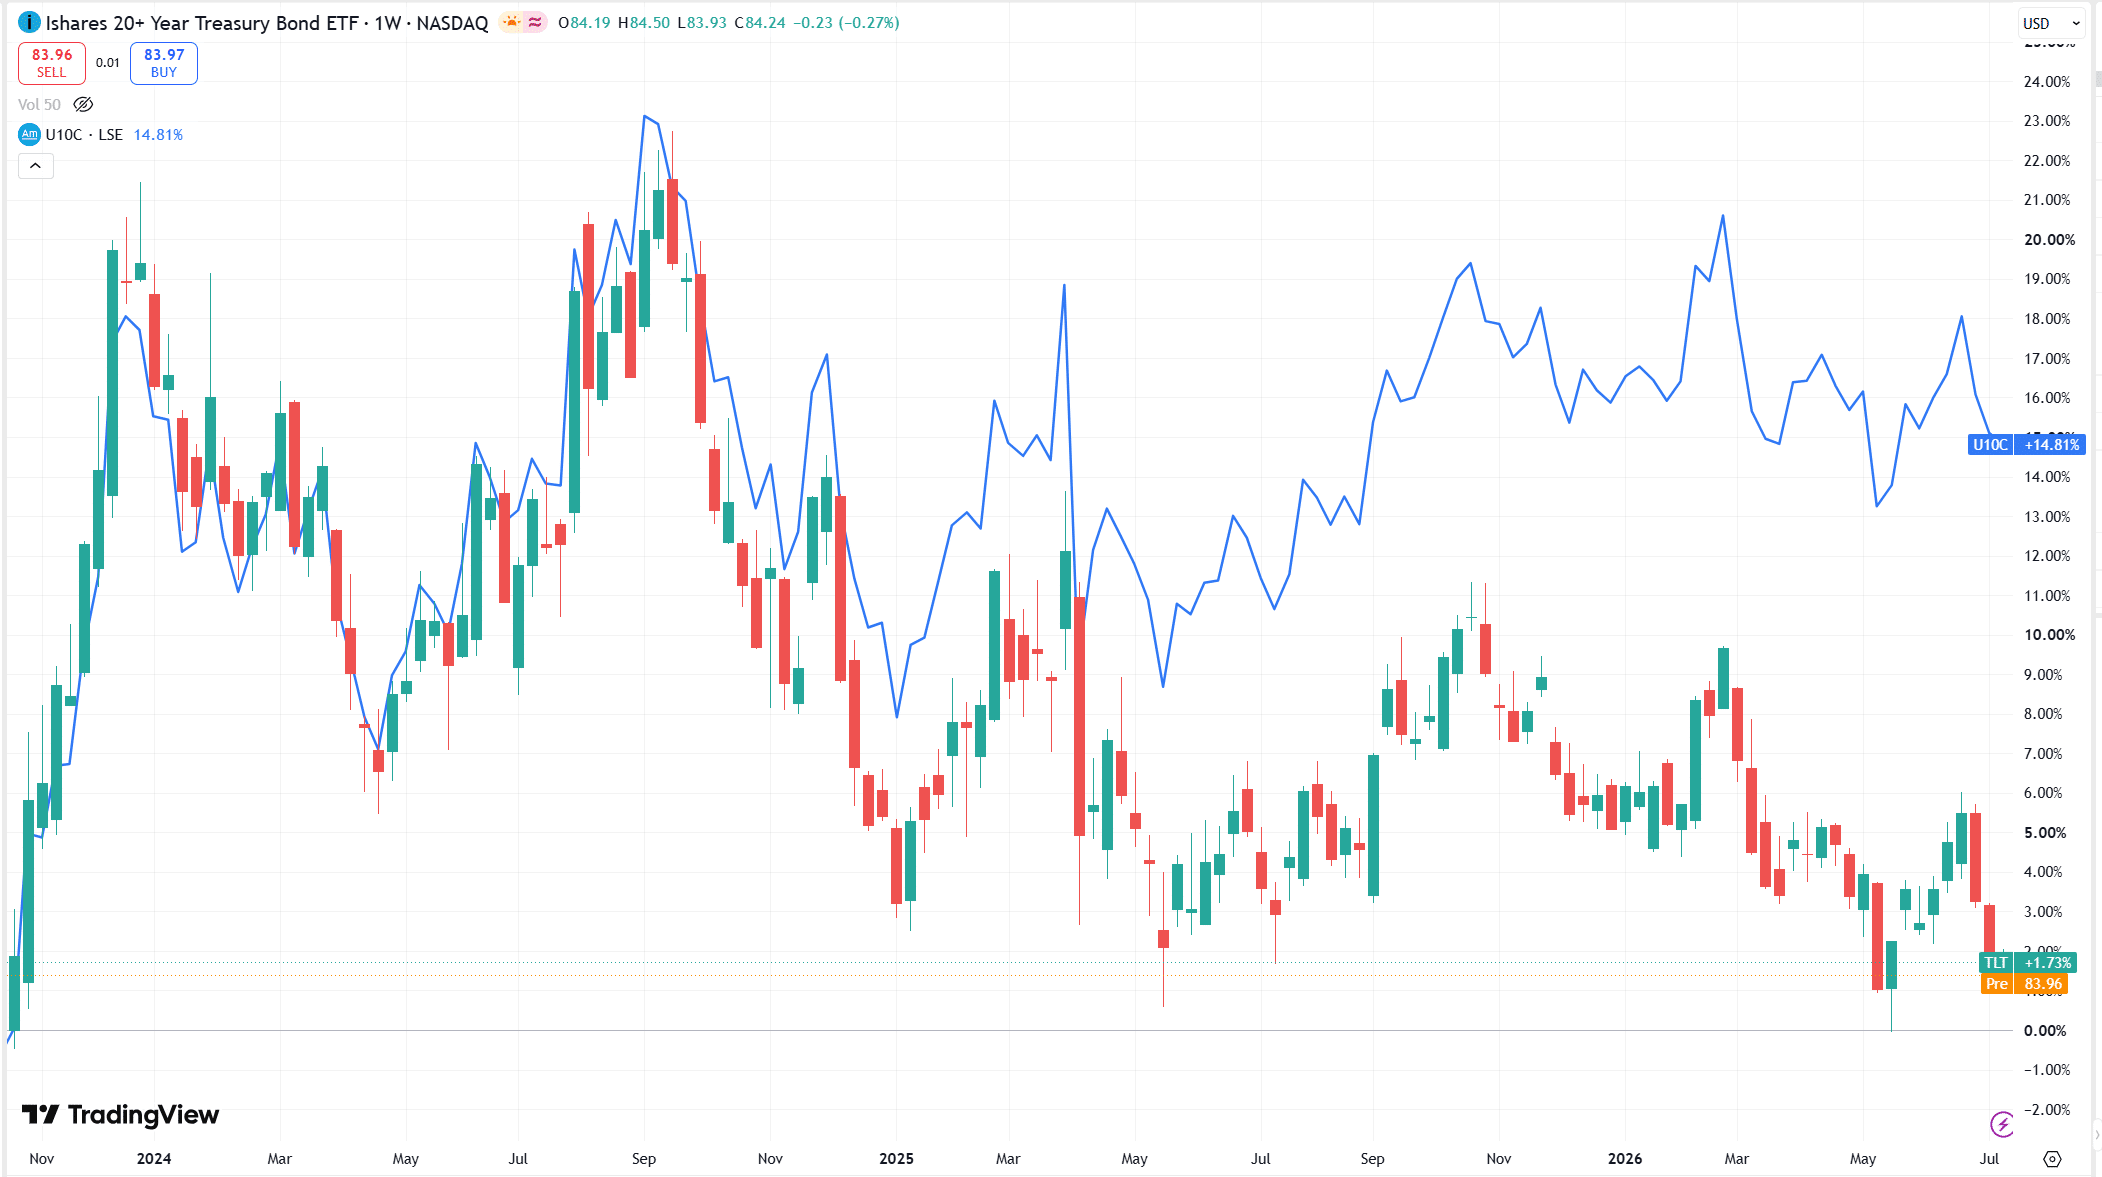
Most people look at TLT’s price level and assume long-term Treasuries have performed badly. The reality is different: since the November 2023 high in long-term rates, holders of these securities have realized a net return, including dividends, of around 15%. TLT is still trading near its 2023 lows, but holders have been collecting roughly 4.8% per annum along the way — which is why they aren’t panicking.
Implied Volatility Is Historically Low
VIXTLT, pictured below, measures the 30-day implied volatility of TLT. It’s a relatively new index — under two years old — but the signal is clear.
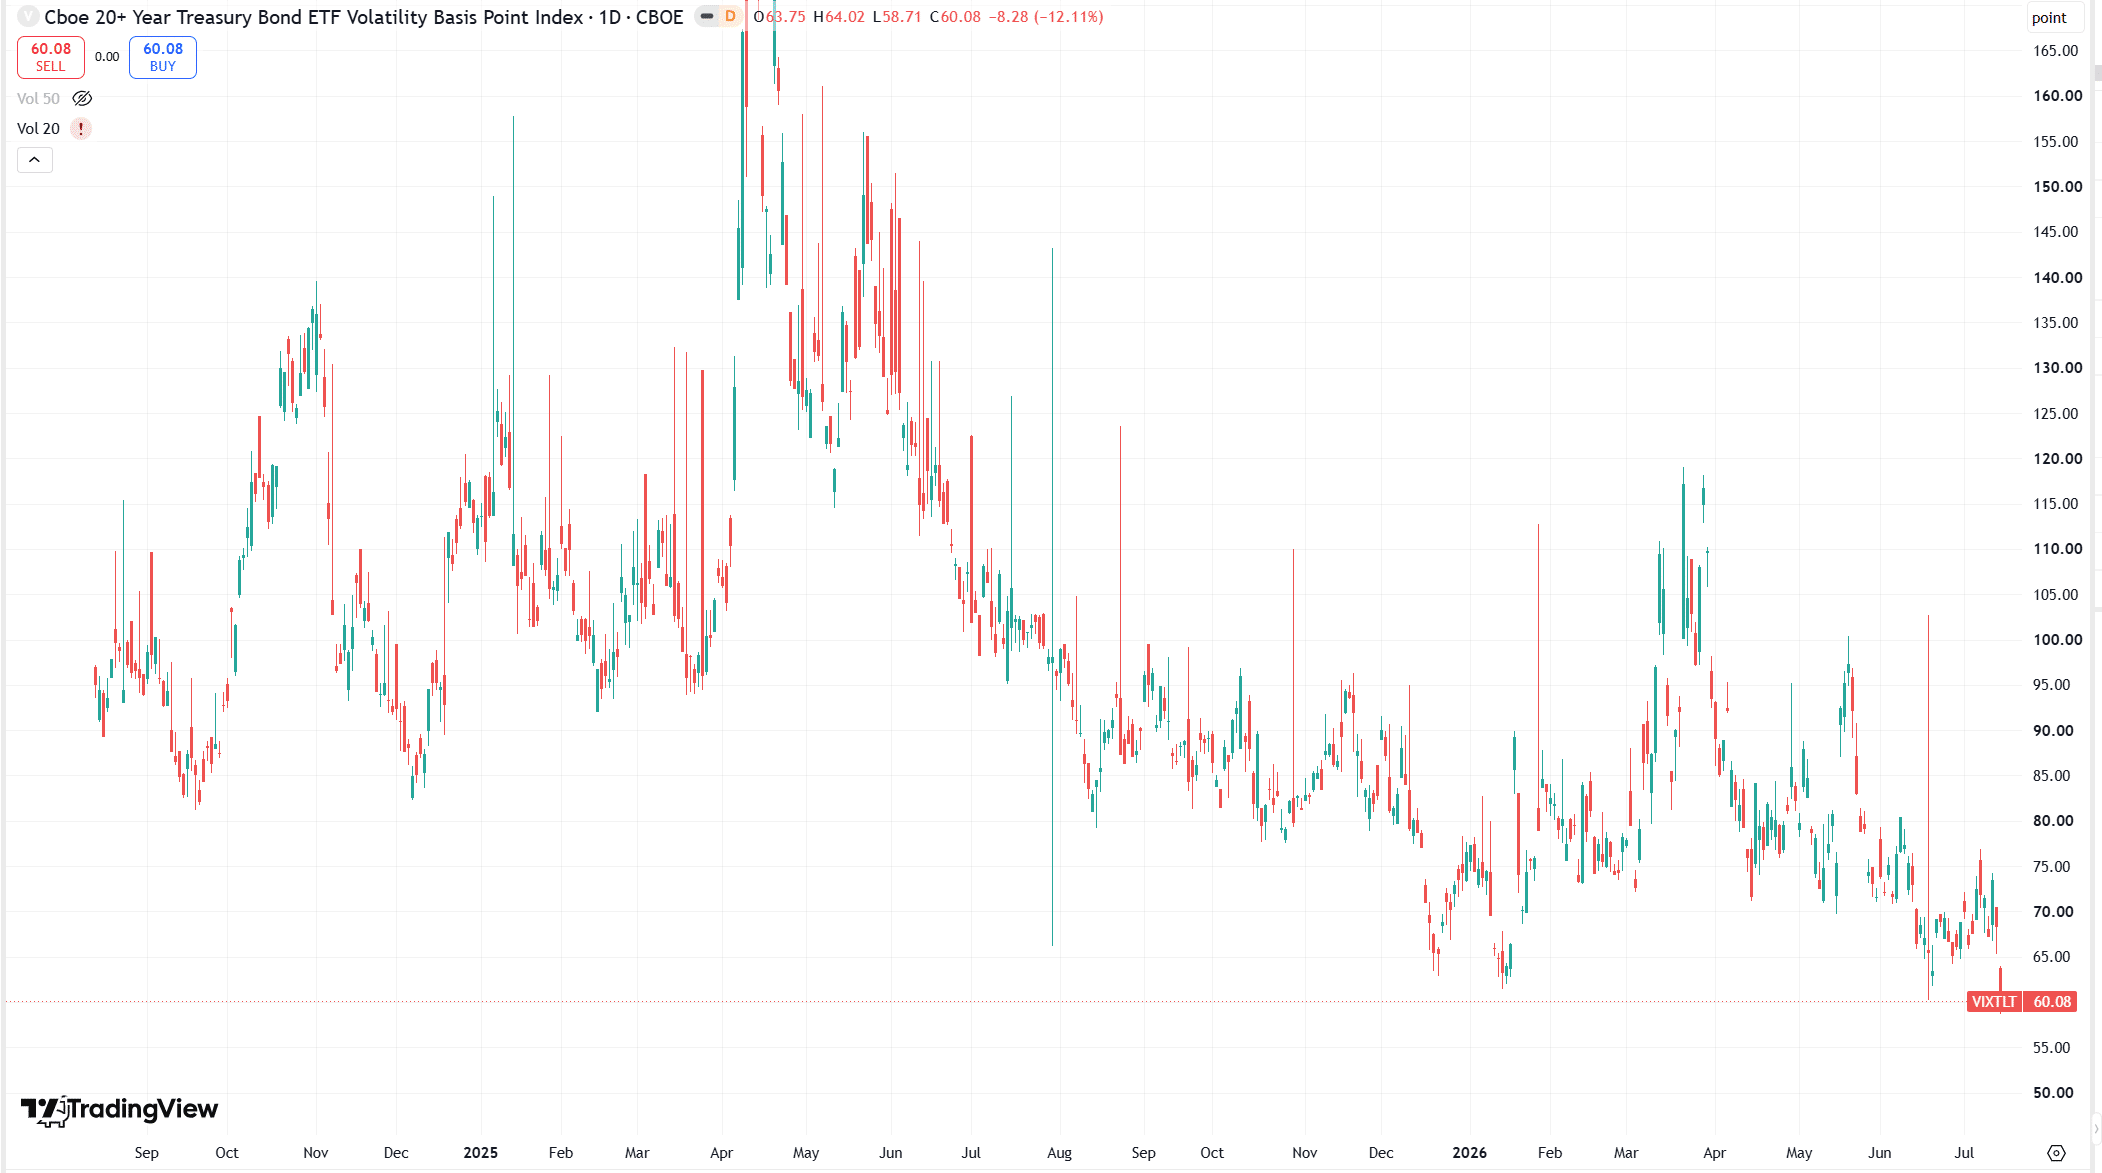
Options market makers are currently pricing in a notably calm next 30 days: implied volatility is running as much as 2.5 times lower than it was in late 2023.
Our Bottom Line
Taken together, four factors shape our view on US Treasuries:
- The Fed’s need to balance employment against price stability
- Resilient total-return performance in long-term Treasuries once coupons are factored in
- Compressed implied volatility expectations
- An unusually wide gap between nominal yields and long-term inflation expectations
Disclaimer
The articles, podcasts, and newsletters from Alaric Securities OOD are classified as marketing communications. The views expressed are solely those of the individual authors affiliated with Alaric Securities OOD and do not necessarily reflect the views of the company, its subsidiaries, or affiliates. This content is provided for informational purposes only. It does not constitute investment advice, a recommendation, or a solicitation to buy or sell any security, digital asset (such as cryptocurrency), or other financial instrument. Third-party content is included solely for informational purposes and does not reflect the views of Alaric Securities OOD. All investments involve risk, including the possible loss of principal. Past performance is not indicative of future results. References to third-party companies, logos, or trademarks are used under fair use/fair dealing principles for analysis and commentary.
Stay Ahead with Alaric Securities Newsletters
Traders and investors don't need more information - they need better information. That’s what we deliver!
Step back from the daily noise. Each issue explores market trends, industry shifts, trading opportunities, and exclusive updates — learn what's shaping the markets, not just what's trending online. Ready to get the edge?