
Start every trading day with a quick, actionable snapshot of global markets, key earnings, and the biggest movers across US, Europe, and Asia. Get the insight before your first coffee is gone.
October 14, 2026 | Issue 173
Is the Euro Stoxx 50 Index Too Cheap to Ignore

Nikolay Stoykov
Managing Partner at Alaric Securities

The story of the tape over the last month or so has been one of two stock markets. On the one hand, old-economy indexes such as the Dow Jones Industrial Average and Russell 2000 are about 10% off their highs. On the other hand, the Nasdaq 100 and S&P 500 are at or near their respective all-time highs.
Comparing the S&P 500 with the Dow or the Russell isn’t especially useful, though. The S&P 500 has outperformed both by a wide margin over the long run. So we went looking for a major index with a more comparable track record. We found one in Europe – the Euro Stoxx 50 index.
The Euro Stoxx 50 is the eurozone’s flagship blue-chip index. It tracks 50 of the largest companies in the euro area, weighted by free-float market capitalization. The index includes names like ASML, SAP, LVMH, and Siemens. If the S&P 500 is the benchmark for US large caps, the Euro Stoxx 50 plays the same role for Europe.
Euro Stoxx 50 index vs S&P 500 – what the spread shows
To keep both in the same currency, we used two US dollar-priced ETFs from State Street’s SPDR range -the SPDR S&P 500 ETF Trust (SPY) and the SPDR EURO STOXX 50 ETF (FEZ). Both series are adjusted for dividends, assuming reinvestment. One caveat worth keeping in mind, because FEZ is priced in dollars, its performance also reflects moves in EUR/USD.
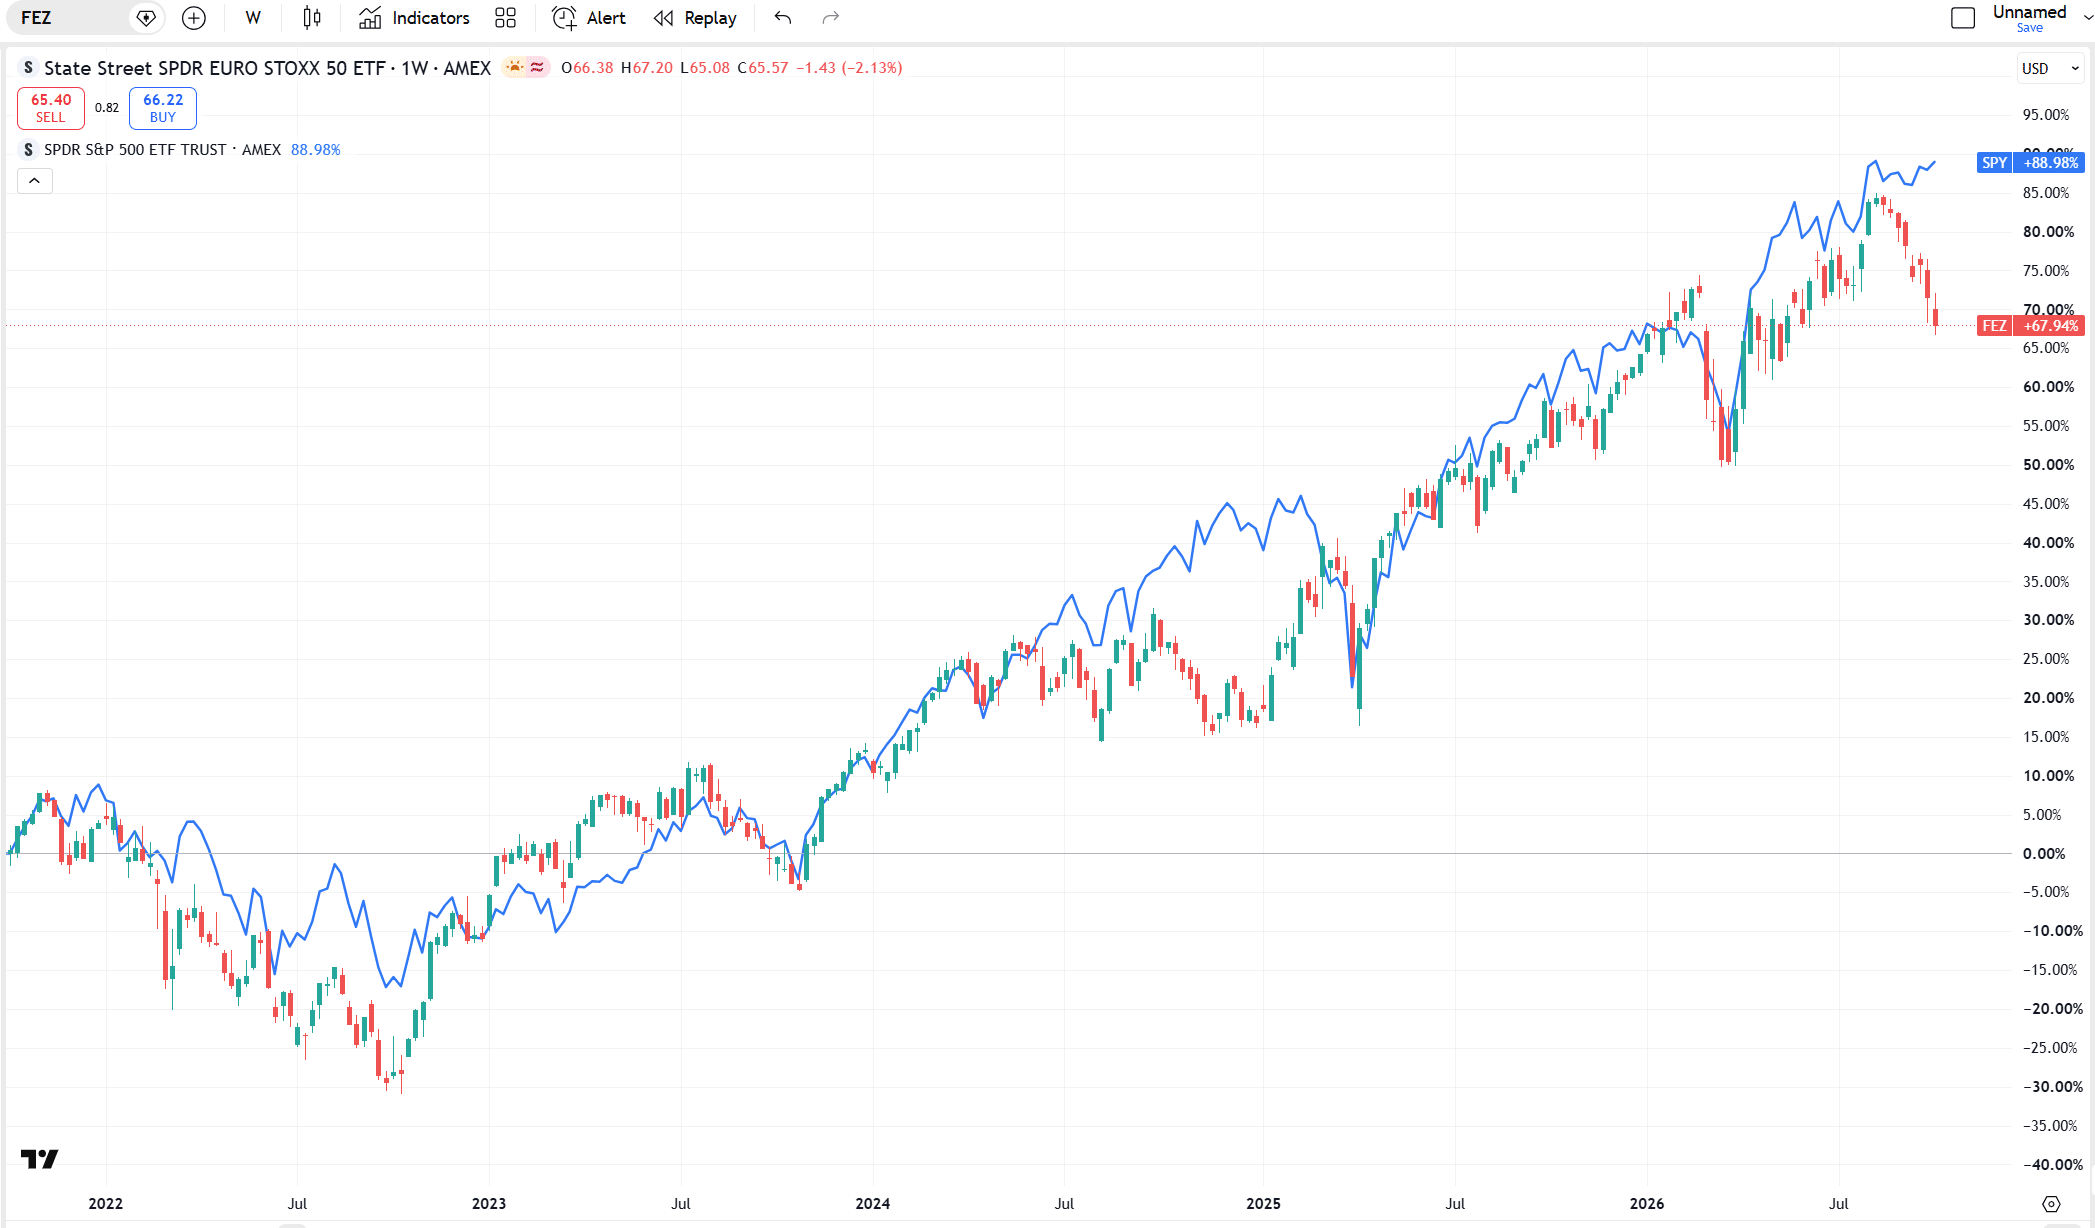
Courtesy of TradingView.com: Five-year chart of the SPDR EURO STOXX 50 ETF (FEZ) and SPDR S&P 500 ETF (SPY) with dividends reinvested.
As you can see, over the period pictured, the two ETFs have tracked each other reasonably well. FEZ has tended to be more volatile than SPY. Historically, that relative volatility has often presented a trading opportunity.
Let’s dig into the numbers (calculations not shown):
🔹Over the period pictured, the FEZ-minus-SPY spread averaged approximately −6%; in other words, FEZ usually traded below SPY relative to our common starting point.
🔹 The standard deviation of the spread was approximately 8 percentage points.
🔹The widest spread occurred around November 2024, when it approached 25 percentage points.
🔹The current spread is approximately −20 percentage points.
Put differently, today’s spread is roughly 1.75 standard deviations below its historical average.
We would be the first to admit that this is not a complete or exhaustive analysis of the relationship between the two securities. Nevertheless, it suggests that, based on their historical relative-performance pattern, the Euro Stoxx 50 currently looks unusually cheap relative to the S&P 500.
How to trade the Euro Stoxx 50 index against the S&P 500
In our view, the cleanest way to express this is to trade exactly what we measured. Long FEZ, short SPY, on a dollar-neutral basis, is our approach. That strips out most of the broad market direction. As a result, it turns the position into a bet on European large caps outperforming US large caps.
The simpler alternative is to go long FEZ on its own. That’s a more directional, and therefore riskier, position. But if the historical relationship starts to normalize, we think FEZ has more room to run than SPY.
The gap between the Euro Stoxx 50 index and the S&P 500 is now about as wide as it has been in five years. History doesn’t guarantee it will close, but it has tended to, and that makes European large caps worth a closer look. In our humble opinion.
Disclaimer
The articles, podcasts, and newsletters from Alaric Securities OOD are classified as marketing communications. The views expressed are solely those of the individual authors affiliated with Alaric Securities OOD and do not necessarily reflect the views of the company, its subsidiaries, or affiliates. This content is provided for informational purposes only. It does not constitute investment advice, a recommendation, or a solicitation to buy or sell any security, digital asset (such as cryptocurrency), or other financial instrument. Third-party content is included solely for informational purposes and does not reflect the views of Alaric Securities OOD. All investments involve risk, including the possible loss of principal. Past performance is not indicative of future results. References to third-party companies, logos, or trademarks are used under fair use/fair dealing principles for analysis and commentary.
Stay Ahead with Alaric Securities Newsletters
Traders and investors don't need more information - they need better information. That’s what we deliver!
Step back from the daily noise. Each issue explores market trends, industry shifts, trading opportunities, and exclusive updates — learn what's shaping the markets, not just what's trending online. Ready to get the edge?