
Start every trading day with a quick, actionable snapshot of global markets, key earnings, and the biggest movers across US, Europe, and Asia. Get the insight before your first coffee is gone.
August 19, 2026 | Issue 167
EURUSD Forecast 2026: Why 1.10 Is Next

Nikolay Stoykov
Managing Partner at Alaric Securities

EURUSD has climbed to levels that appear stretched relative to its long-term fair value. Using a 48-month Bollinger Band model and comparing US and German breakeven inflation rates, this EURUSD forecast argues that the pair is overvalued. Therefore, it is likely to revert toward 1.10 in the months ahead, an outcome worth noting in relation to many EURUSD Forecast 2026 scenarios.
EURUSD 10-Year Monthly Chart: Bollinger Band Setup
We start with a 10-year monthly chart of EURUSD, courtesy of TradingView. On this chart, we apply a Bollinger Band with a 48-month mean and 1.8 standard deviations. This setup is frequently referenced in EURUSD Forecast 2026 analysis for its reliability.
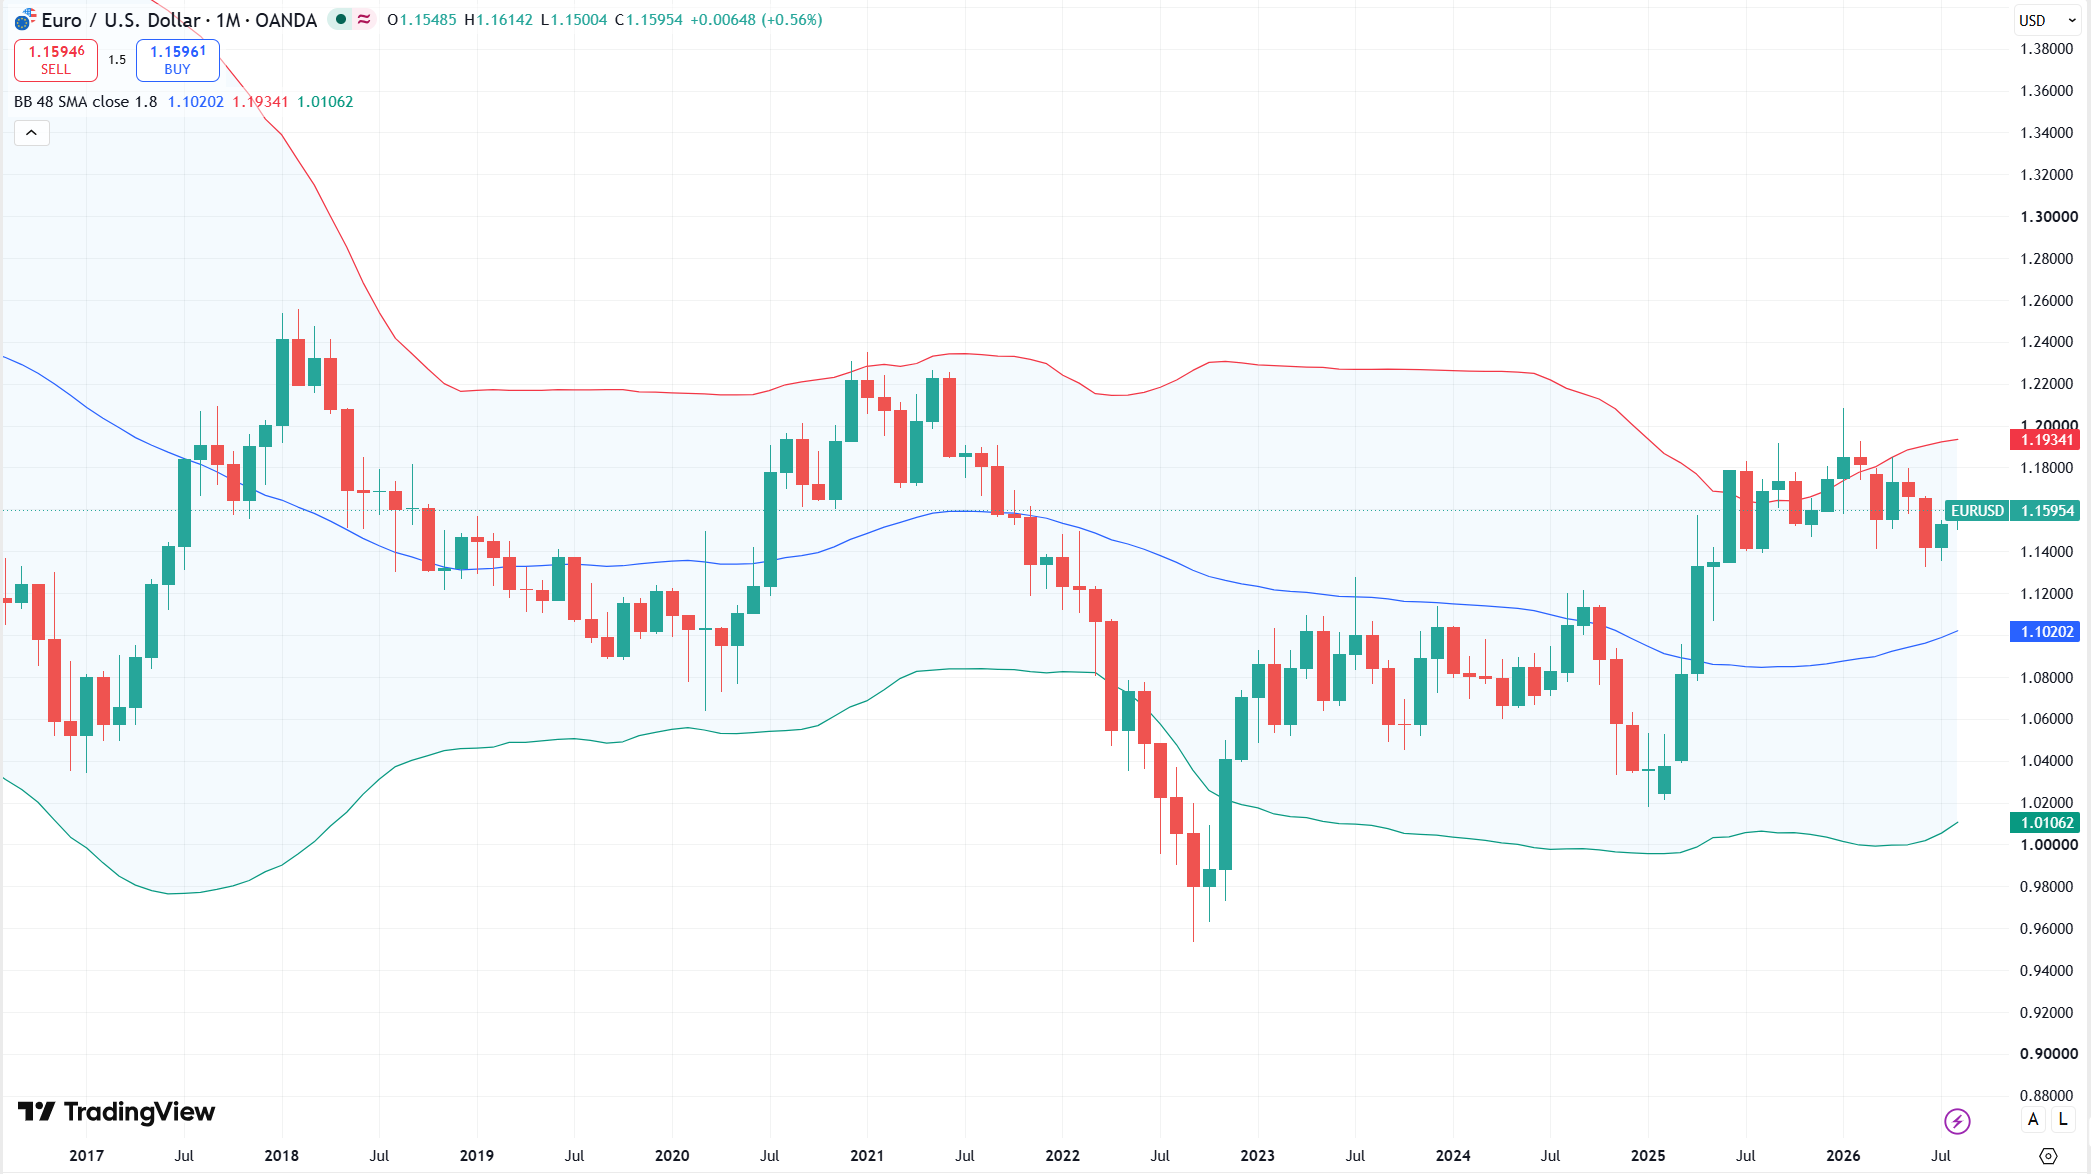
The logic behind this setup is simple: most major currency pairs trade around a relatively stable long-term fair value. Much of the price action away from that value is noise rather than signal. A 48-month moving average smooths out short-term swings. Thus, it gives a cleaner read on where EURUSD “should” be trading.
Right now, the 48-month moving average sits at 1.10201, while EURUSD trades at 1.15928. That gap puts the pair well above its statistical fair value.
We chose a bandwidth of 1.8 standard deviations because it captures roughly 95% of monthly closes in our sample. Across 120 monthly observations spanning 10 years, only 5 months — about 4% of the data — fall outside the bands. As a result, the bands make a reasonably tight fence around price behavior.
This makes them a useful way to flag when EURUSD is trading at an extreme, particularly in the context of EURUSD Forecast 2026 estimates.
What the 48-Month Mean Reversion Model Suggests
If this model holds, EURUSD should drift back toward its 48-month mean of roughly 1.10. Should the pair instead continue higher, the upper Bollinger Band — currently at 1.19339 — offers a reasonable ceiling. This marks how far the move could extend before mean reversion pressure becomes hard to ignore. In turn, these technical points are all relevant for those seeking a EURUSD Forecast 2026 perspective.
This isn’t the first time we’ve flagged EURUSD as overextended — in our earlier piece, EURUSD Forecast: Why 1.14 Is Unsustainable, we made a similar case when the pair was trading near 1.14. The pair has since pushed even further from fair value, reinforcing the same underlying thesis.
In short – the further EURUSD trades above 1.10201, the more the statistical odds favor a pullback rather than a continuation.
US vs. German Breakeven Inflation Rates: The Case for a Weaker Euro
The technical picture doesn’t stand alone. US and German breakeven inflation rates — a market-based measure of expected inflation over the next 10 years — reinforce the case for a lower EURUSD.
Looking at 17 years of data (US break evens from Federal Reserve Bank, German break evens from MacroMicro.me), the two series are highly correlated and currently sit close together. Specifically, the US 10-year breakeven rate is 2.27%, versus 2.02% in Germany.
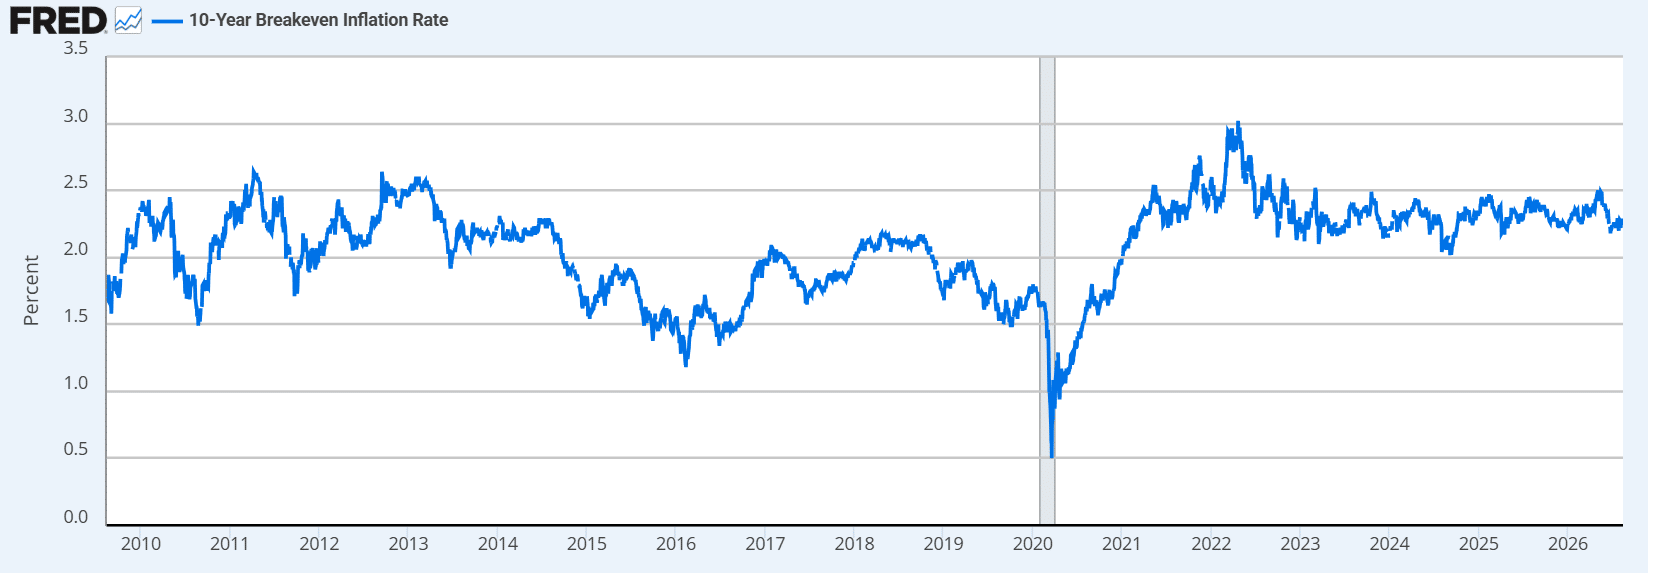
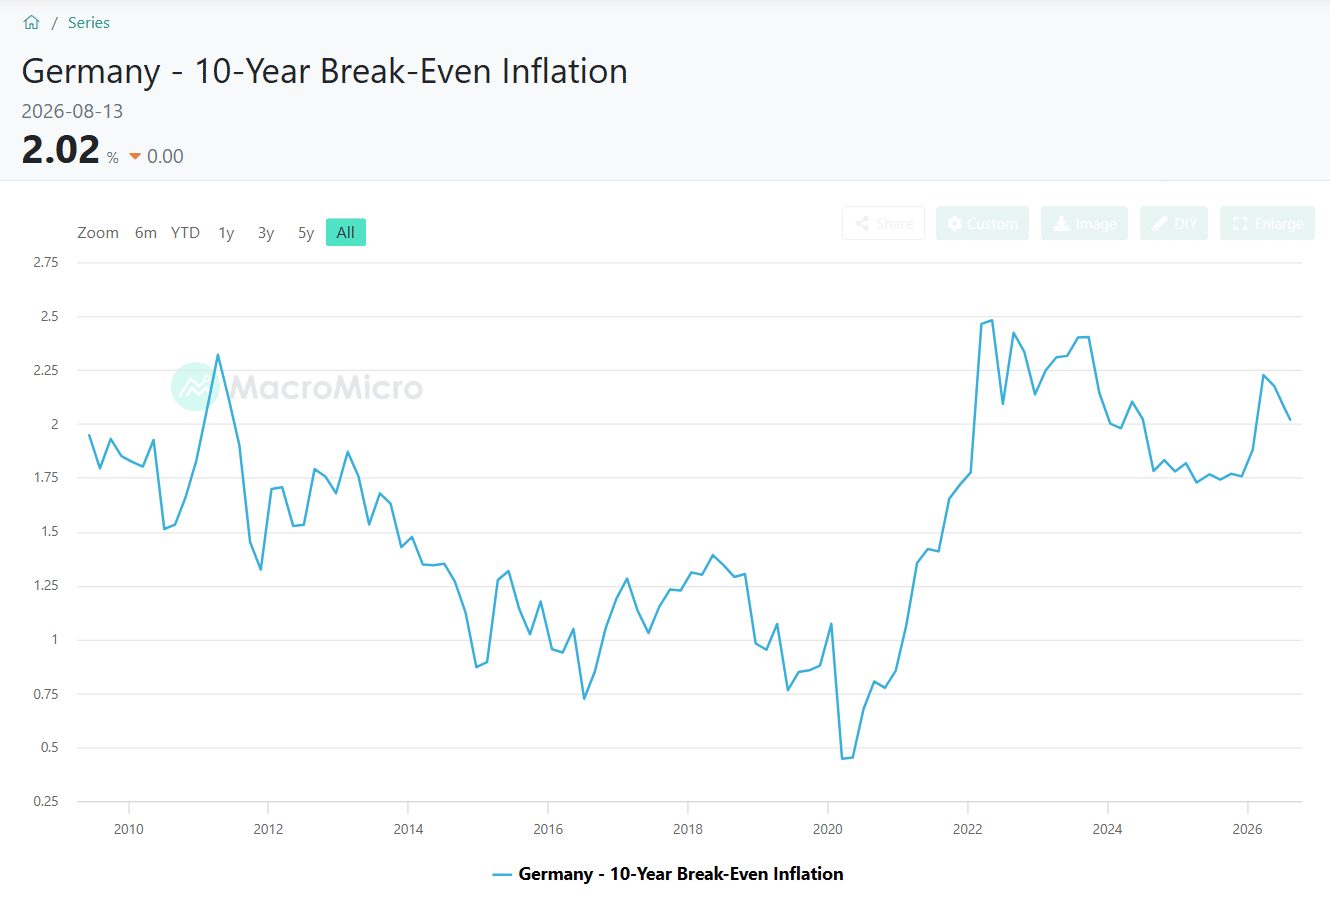
That’s the key point. Inflation expectations alone aren’t pulling EURUSD higher — they’re nearly identical across both economies. Meanwhile, US interest rates remain significantly higher than German rates. When inflation expectations are this closely matched but the interest-rate differential clearly favors the dollar, the case for a much stronger euro largely falls apart. In fact, carry and yield, not inflation divergence, should be doing the heavy lifting here. They point the other way.
EURUSD Price Targets: Upside and Downside Scenarios
Putting the technical and macro pictures together:
Base case / downside target: EURUSD reverts toward its long-term mean near 1.10, consistent with both the 48-month Bollinger Band midline and the interest-rate differential argument.
Upside limit: If EURUSD continues to run higher instead, the upper Bollinger Band at 1.19339 represents a statistically reasonable ceiling before the odds of a reversal increase further.
Disclaimer
The articles, podcasts, and newsletters from Alaric Securities OOD are classified as marketing communications. The views expressed are solely those of the individual authors affiliated with Alaric Securities OOD and do not necessarily reflect the views of the company, its subsidiaries, or affiliates. This content is provided for informational purposes only. It does not constitute investment advice, a recommendation, or a solicitation to buy or sell any security, digital asset (such as cryptocurrency), or other financial instrument. Third-party content is included solely for informational purposes and does not reflect the views of Alaric Securities OOD. All investments involve risk, including the possible loss of principal. Past performance is not indicative of future results. References to third-party companies, logos, or trademarks are used under fair use/fair dealing principles for analysis and commentary.
Stay Ahead with Alaric Securities Newsletters
Traders and investors don't need more information - they need better information. That’s what we deliver!
Step back from the daily noise. Each issue explores market trends, industry shifts, trading opportunities, and exclusive updates — learn what's shaping the markets, not just what's trending online. Ready to get the edge?