
Start every trading day with a quick, actionable snapshot of global markets, key earnings, and the biggest movers across US, Europe, and Asia. Get the insight before your first coffee is gone.
October 21, 2026 | Issue 174
EURUSD Forecast October 2026: Bond Spreads Change the Picture

Nikolay Stoykov
Managing Partner at Alaric Securities

In our EURUSD forecast for October 2026, we revisit the currency pair we covered in our August article – EURUSD Forecast 2026: Why 1.10 Is Next. At the time the pair was trading around 1.1675, while last week it traded as low as 1.1130. Usually, we would note that the pair has moved in the direction we expected and move on. However, recent developments have caused us to revisit the topic once again.
The 200-Week Bollinger Band View of EURUSD
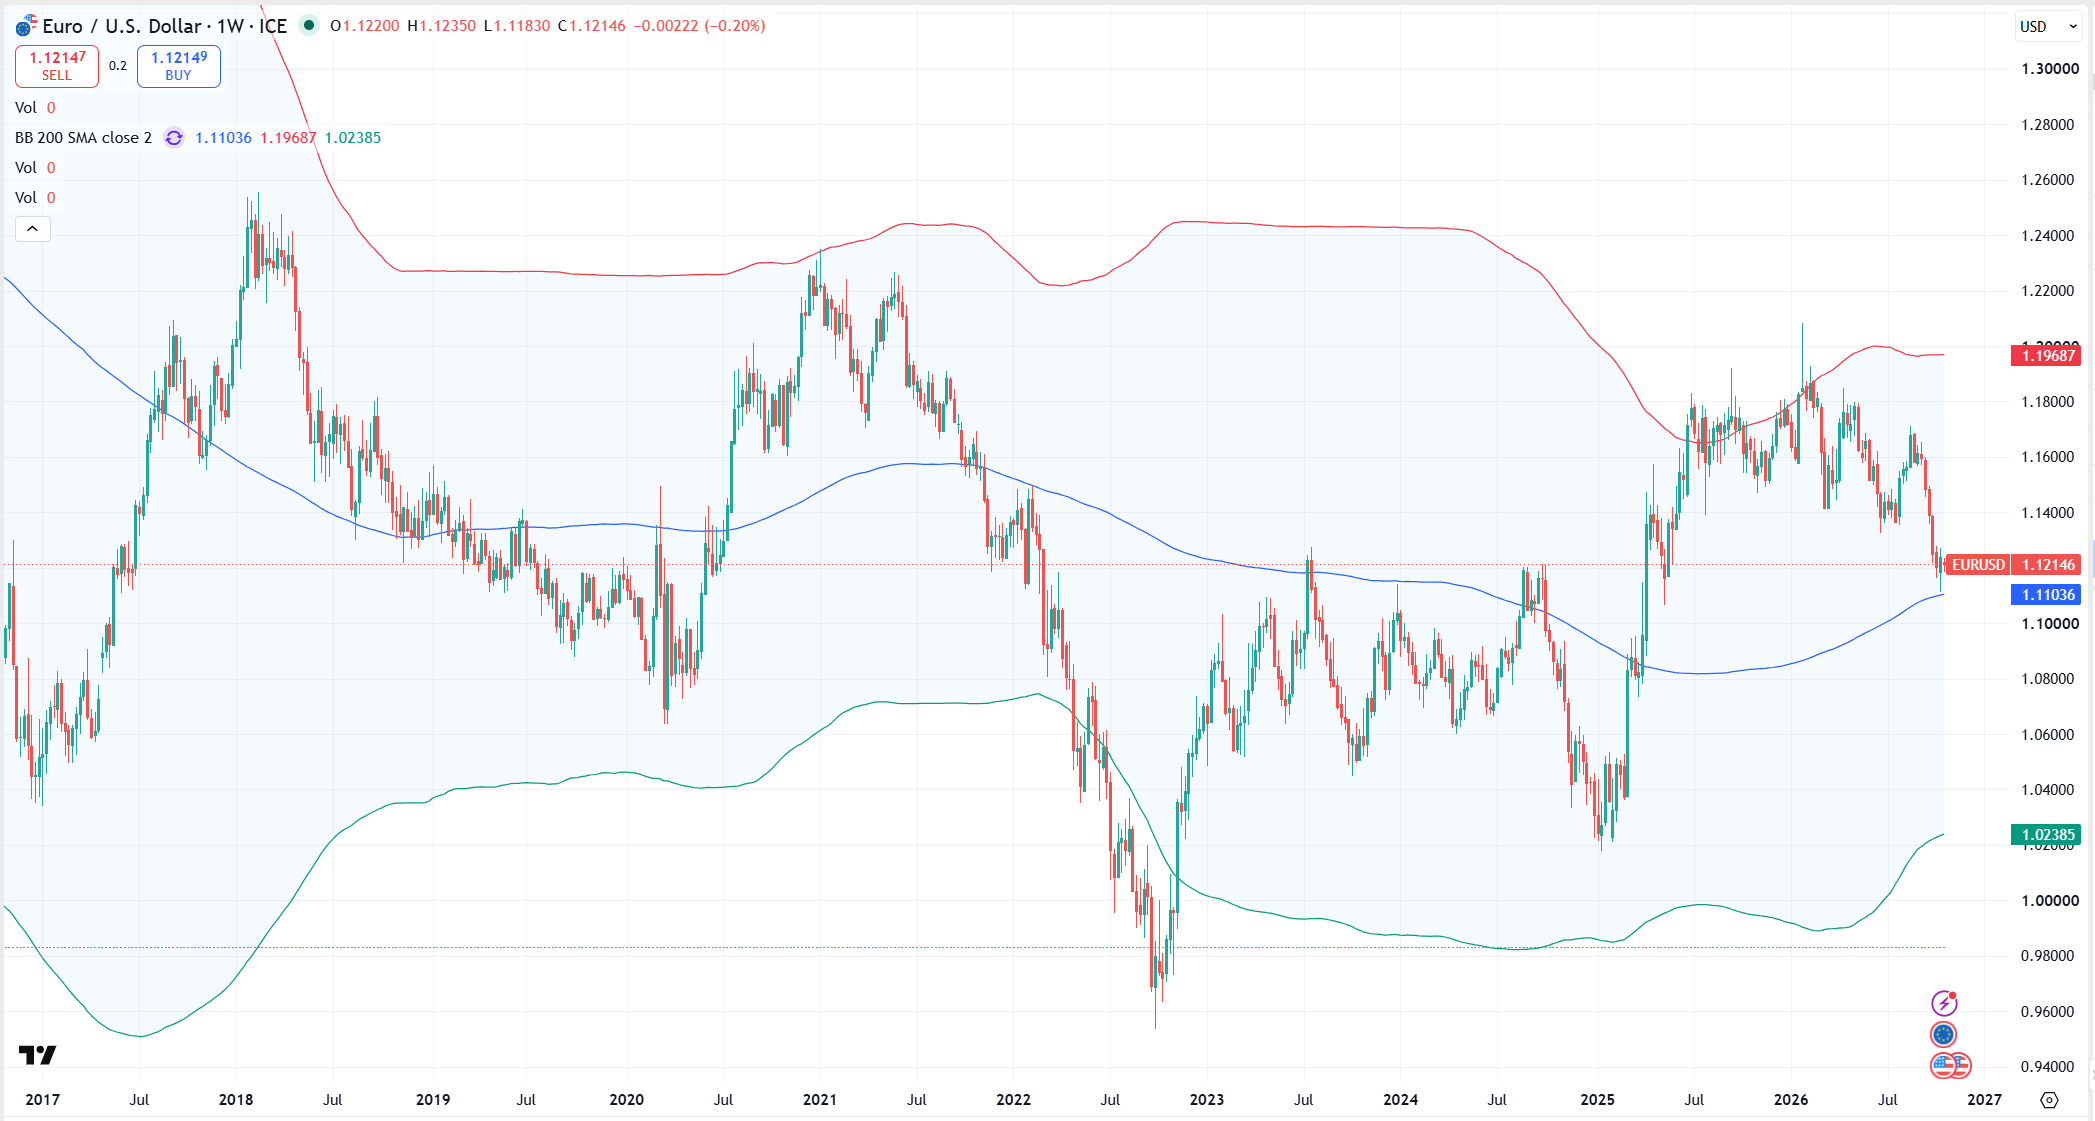
Let’s start with our preferred way of looking at the currency pair – the 200-week average Bollinger Band with a 2 standard deviation band:
Why This Indicator Works for the Pair
Why do we think this technical indicator is a useful way of looking at EURUSD?
1. Inflation in the euro area and the US has been relatively similar.
Over the past five years, US CPI has increased by approximately 22.8%, from 274.31 in September 2021 to 336.94 in September 2026.
Over the same period, our euro-area inflation series shows a cumulative increase of approximately 23.8%, from 84.26 to 104.31.
2. Expected inflation, as measured by 10-year breakeven inflation rates, is also relatively similar.
The US 10-year breakeven inflation rate is currently around 2.35% per year, compared with approximately 2.15% for Germany.
Although these measures are not perfectly comparable, the relatively small difference indicates that markets are not anticipating a major divergence in inflation over the coming decade.
3. Central-bank interest-rate policies have become more interlinked.
Changes in interest rates by major central banks, including the ECB and the Federal Reserve, are influenced by progressively interconnected economies and financial markets.
That does not mean the two central banks will always move together. However, we believe that globalization makes prolonged and extreme monetary-policy divergence less likely.
Taken together, these considerations support our use of a long-term historical framework for EURUSD.
Why Mean Reversion No Longer Drives Our Outlook
According to our 200-week Bollinger Band model, the pair’s central value is currently around 1.10, with a two-standard-deviation range of approximately 1.025 to 1.195.
At the time of our previous blog, EURUSD was trading considerably closer to the upper band. As a result, our expectation of a move toward the long-term average was based on a mean-reversion argument.
With EURUSD now trading around 1.12, much closer to its long-term average, that statistical argument has become considerably weaker. On the basis of the Bollinger Band model alone, forecasting the next move in either direction should be relatively difficult.
What Has Changed in Our EURUSD Forecast for October 2026
However, something important has changed since August. Government bond yields within the euro area have begun to diverge, and not only at the long end of the yield curve.
Since mid-August, the German two-year government bond yield has increased from approximately 2.84% to 3.08%.
Meanwhile, the French two-year yield has risen from around 3.05% to 3.60%, while the Italian two-year yield has increased from approximately 3.06% to 3.50%.
In other words, French and Italian borrowing costs have increased substantially more than German borrowing costs.
This is important because we are no longer looking exclusively at differences in long-term fiscal risk. We are also seeing widening spreads in relatively short-dated government bonds, which are generally more sensitive to expectations about monetary policy.
Such divergence generates concerns about financial fragmentation across the euro area.
The ECB’s Dilemma
So far, the widening spreads have not produced a decisive policy response capable of reversing the trend. That does not mean the divergence will necessarily continue or that policymakers will fail to address it.
However, it does complicate the ECB’s position. The ECB sets one policy rate for the entire euro area, but that rate is transmitted through financial markets that are increasingly pricing different levels of sovereign risk.
Consequently, further monetary tightening could have a disproportionately negative impact on countries already experiencing higher borrowing costs.
In our opinion, this makes additional ECB rate increases more difficult, particularly if the divergence persists.
What It Means for the Pair
We believe a weaker euro could help offset some of the adjustment.
A depreciation would improve the external competitiveness of euro-area exporters and could provide some support to economic activity, particularly in countries facing tighter financial conditions.
Of course, a weaker currency also raises the cost of imports and can aggravate inflation, especially through energy prices. It is therefore not a costless solution.
Nevertheless, if financial fragmentation increasingly limits the ECB’s room for further tightening, while the Federal Reserve retains greater flexibility to maintain restrictive policy, the resulting monetary-policy divergence could put downward pressure on EURUSD.
With the pair currently trading near the center of its historical range, we believe a renewed decline toward the lower Bollinger Band, around 1.025, is a plausible scenario.
A move toward parity cannot be ruled out either, although it would represent a more substantial deviation from our long-term statistical benchmark.
Where This Leaves Our EURUSD Forecast for October 2026
Recent divergence in short-dated euro-area government bond yields is putting the ECB in an increasingly uncomfortable position. While inflation pressures may argue for higher interest rates, financial fragmentation makes further tightening more complicated.
We believe that this tension increases the risk of euro weakness against the US dollar.
Our revised EURUSD forecast for October 2026 is therefore that the pair could trade toward the lower end of its long-term range, around 1.025, with parity becoming a possibility if sovereign-bond stress intensifies.
The important difference from our August forecast is that this is no longer primarily a mean-reversion trade. Instead, it is a view about the possible consequences of diverging financial conditions within a monetary union.
Disclaimer
The articles, podcasts, and newsletters from Alaric Securities OOD are classified as marketing communications. The views expressed are solely those of the individual authors affiliated with Alaric Securities OOD and do not necessarily reflect the views of the company, its subsidiaries, or affiliates. This content is provided for informational purposes only. It does not constitute investment advice, a recommendation, or a solicitation to buy or sell any security, digital asset (such as cryptocurrency), or other financial instrument. Third-party content is included solely for informational purposes and does not reflect the views of Alaric Securities OOD. All investments involve risk, including the possible loss of principal. Past performance is not indicative of future results. References to third-party companies, logos, or trademarks are used under fair use/fair dealing principles for analysis and commentary.
Stay Ahead with Alaric Securities Newsletters
Traders and investors don't need more information - they need better information. That’s what we deliver!
Step back from the daily noise. Each issue explores market trends, industry shifts, trading opportunities, and exclusive updates — learn what's shaping the markets, not just what's trending online. Ready to get the edge?