
Start every trading day with a quick, actionable snapshot of global markets, key earnings, and the biggest movers across US, Europe, and Asia. Get the insight before your first coffee is gone.
July 16, 2026 | Issue 164
Middle East Crisis 2.0: Is the conflict back on

Nikolay Stoykov
Managing Partner at Alaric Securities

The Middle East crisis is back in the headlines, and the news over the past week has been bad. The US and Iran have both said the Memorandum of Understanding that settled the conflict, signed on June 17, 2026, is off. Traffic through the Strait of Hormuz is once again effectively stopped, and oil prices are up. Does this mean the crisis is worsening? Could oil go back to 100 USD per barrel?
The truth is, it could. But oil options prices suggest that’s not the most likely outcome. Here’s why.
WTI Oil Prices Since the Middle East Crisis Began
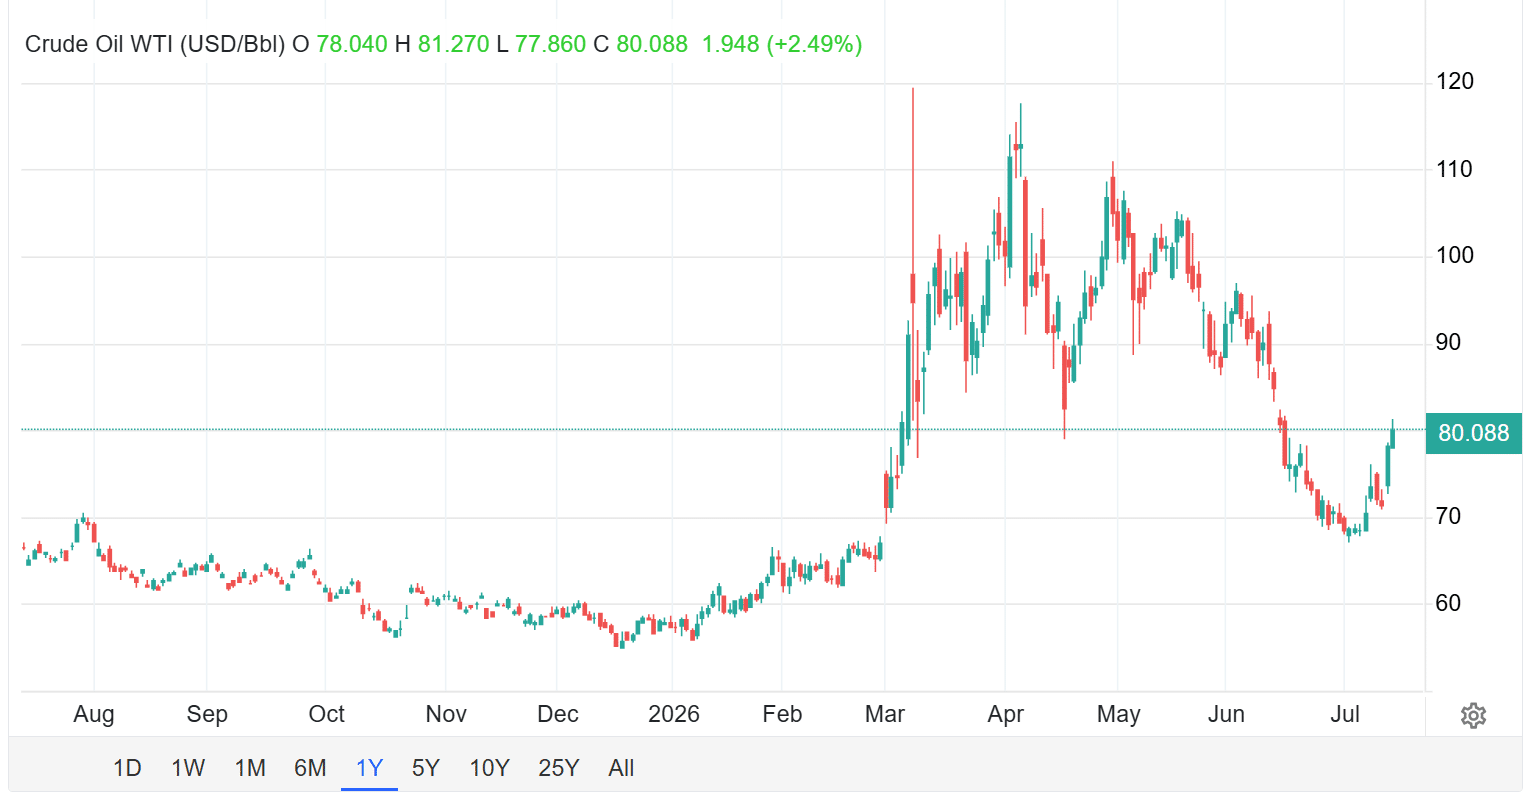
Image: 6-month WTI oil price chart. Courtesy of Trading Economics.
WTI spot prices sat around 60 USD per barrel before the conflict began. At the most tumultuous point, they climbed as high as 120 USD per barrel. Over the past week, they’ve risen from 68 USD per barrel to just over 80 USD per barrel.
Yes, prices have risen. But they’re still much closer to pre-conflict levels than to the middle of that range, and far from the 120 USD per barrel extreme.
What Oil Options Are Pricing In
Next, consider oil option prices. We’ll use option prices based on the USO ETF, since its options are far more liquid and transparent than the WTI futures themselves.
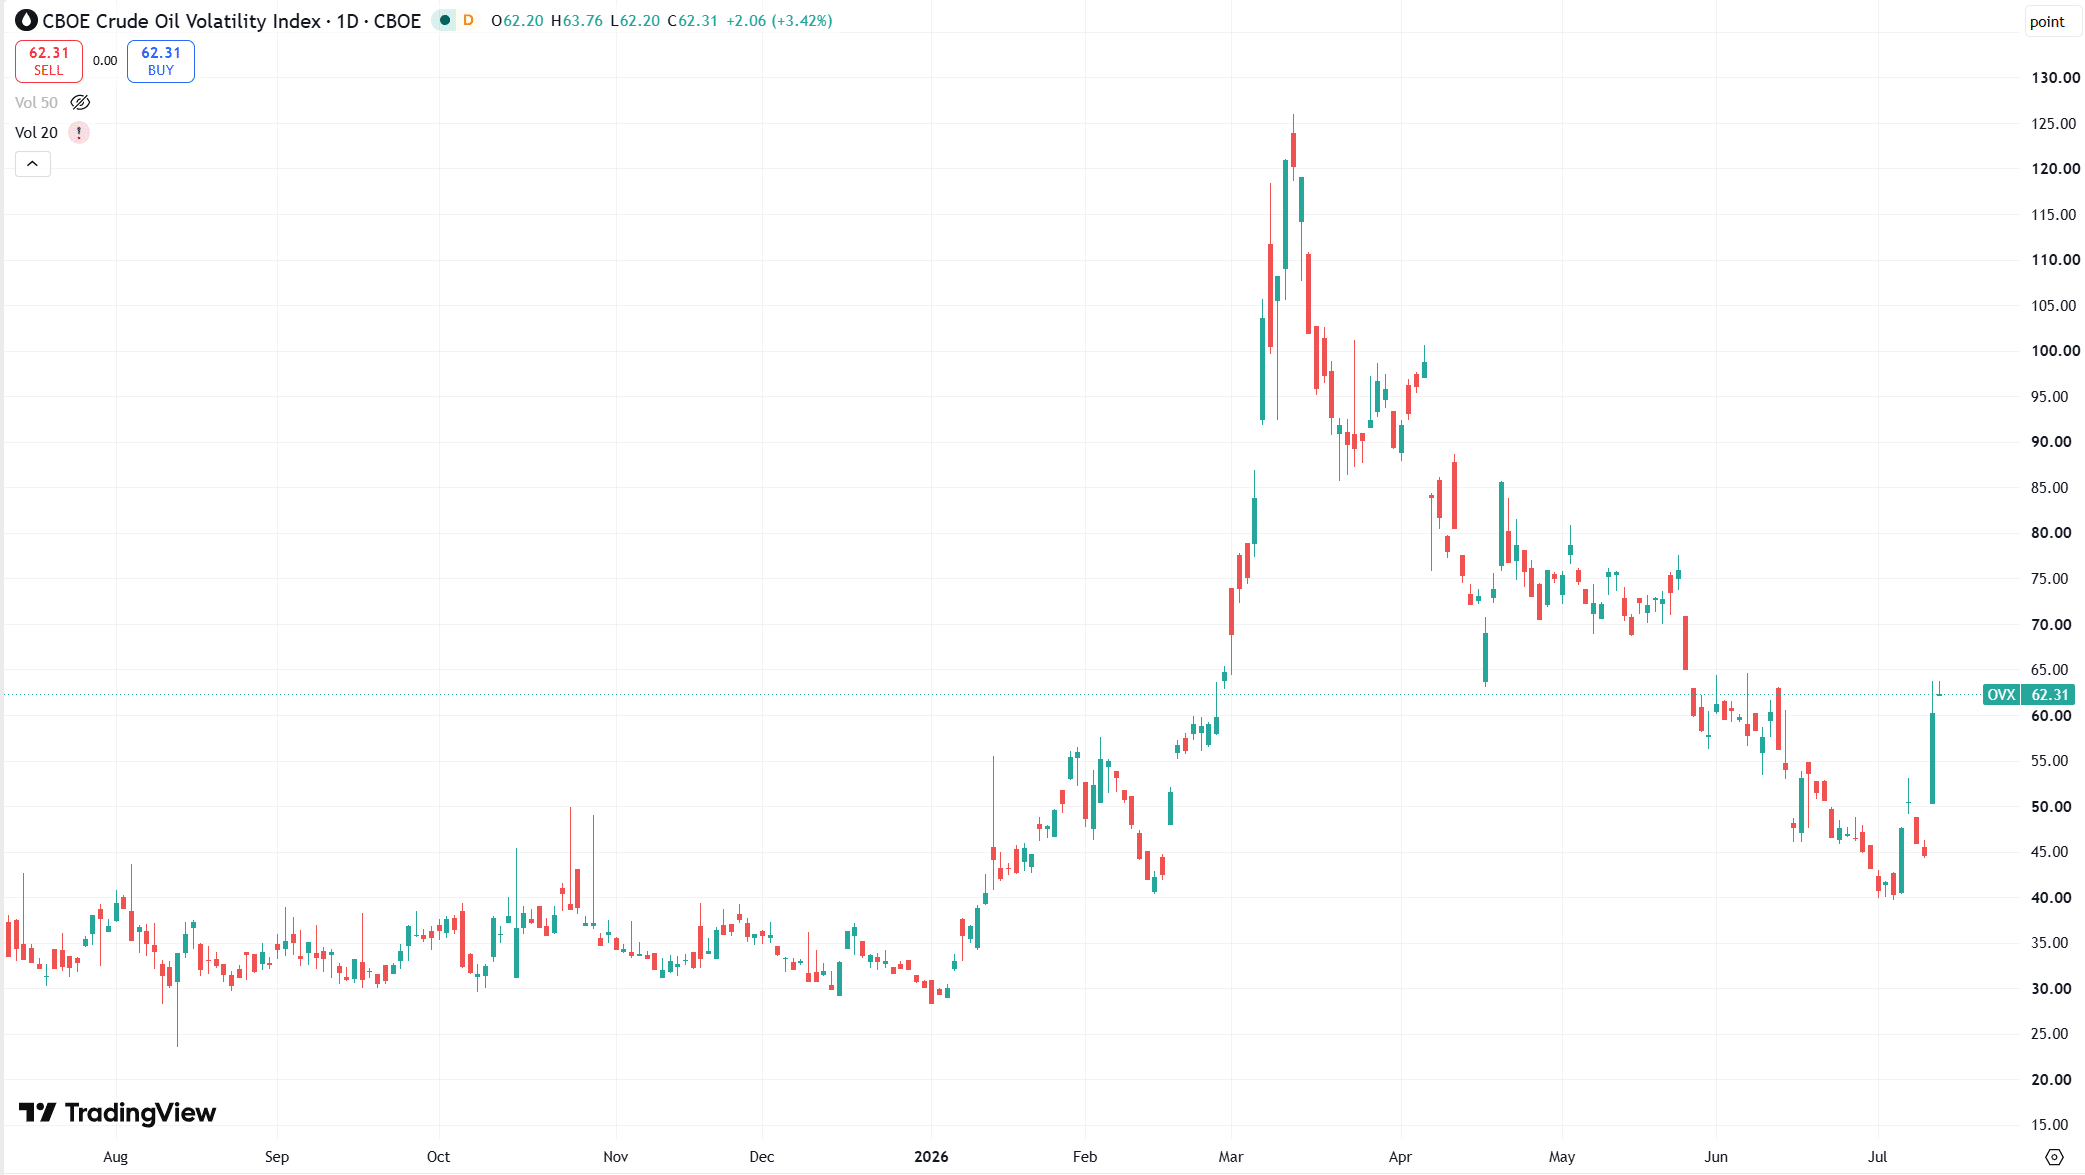
Image: 30-day implied volatility of USO, the OVX Index. Courtesy of TradingView.
The OVX measures the market’s expected volatility in oil prices over the next 30 days (option purists, bear with the simplification). Its current level of 62% is elevated. But like WTI spot prices, that’s much closer to oil’s “natural” volatility of around 40% than to the 130% readings seen at the height of the conflict.
The Volatility Term Structure Explained
Finally, look at the volatility term structure of USO prices. We’ll use the listed USO 120 calls for August, September, and October maturities:
- August (USO August 21 120 calls): implied volatility of 55%
- September (USO September 18 120 calls): implied volatility of 51.50%
- October (USO October 16 120 calls): implied volatility of 49%
From these numbers, we can extrapolate expected volatility for each period. Between now and August 21, USO and oil prices are expected to move at 55% annualized volatility. From August 21 to September 18, that drops to 46%. From September 18 to October 16, it falls further, to 42%.
What This Means for Oil Prices
Taken together, this pricing implies that volatility tied to the Middle East crisis will return to its normal range of 35-40% annualized within the next 60 days.
The news is not good, and the current standoff resembles the height of the conflict: there’s still nearly no traffic through the Strait of Hormuz. Yet markets are pricing in a return to near-normal volatility within two months. It may sound counterintuitive, but that’s what the numbers are telling us.
Disclaimer
The articles, podcasts, and newsletters from Alaric Securities OOD are classified as marketing communications. The views expressed are solely those of the individual authors affiliated with Alaric Securities OOD and do not necessarily reflect the views of the company, its subsidiaries, or affiliates. This content is provided for informational purposes only. It does not constitute investment advice, a recommendation, or a solicitation to buy or sell any security, digital asset (such as cryptocurrency), or other financial instrument. Third-party content is included solely for informational purposes and does not reflect the views of Alaric Securities OOD. All investments involve risk, including the possible loss of principal. Past performance is not indicative of future results. References to third-party companies, logos, or trademarks are used under fair use/fair dealing principles for analysis and commentary.
Stay Ahead with Alaric Securities Newsletters
Traders and investors don't need more information - they need better information. That’s what we deliver!
Step back from the daily noise. Each issue explores market trends, industry shifts, trading opportunities, and exclusive updates — learn what's shaping the markets, not just what's trending online. Ready to get the edge?