
Start every trading day with a quick, actionable snapshot of global markets, key earnings, and the biggest movers across US, Europe, and Asia. Get the insight before your first coffee is gone.
September 16, 2026 | Issue 170
High Yield Credit Spreads Are Showing Cracks

Nikolay Stoykov
Managing Partner at Alaric Securities

What CCC Credit Spreads Reveal About the Next Correction
High yield credit spreads deserve a closer look right now and the data isn’t as comfortable as the headline yields suggest. Start with the ICE BofA CCC & Lower US High Yield Index Total Return Index, a total return index where coupons are reinvested.
Below is a 10-year chart of the index, courtesy of TradingView.
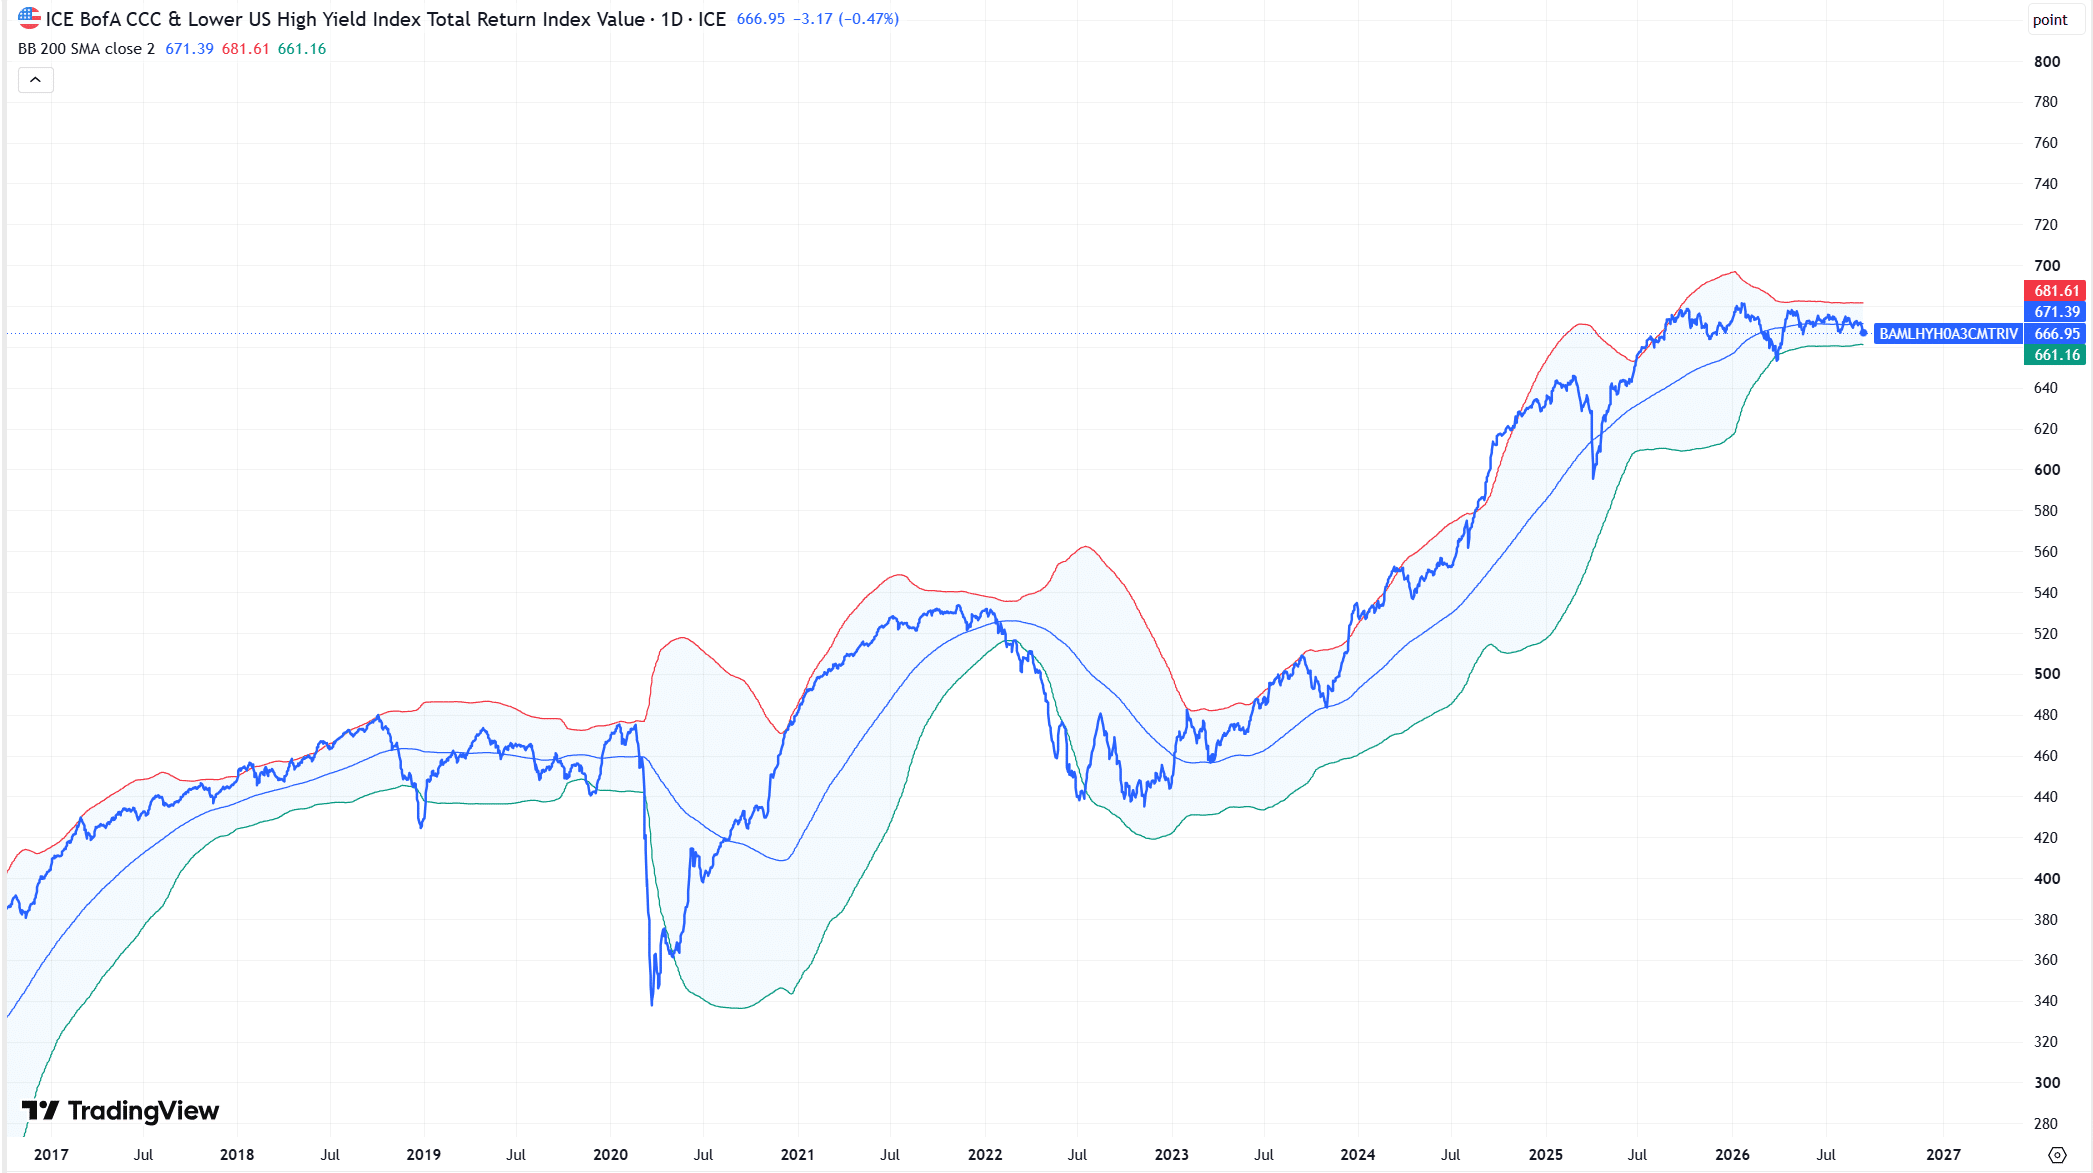
First, we have chosen this particular index because it represents credit obligations most vulnerable to default. There is an ETF, XCCC, that provides exposure to CCC-rated US corporate debt. However, the ETF does not have as long a history as the index itself. Also, it does not track this particular ICE BofA index.
The index is yielding around 15% per year right now. As our readers can see for themselves, it has averaged about 7% per annum, with reinvestments, for the last 10 years. In addition, it has averaged about 12% per annum for the last 3 years. Usually, the returns of such securities are highly correlated with credit availability and equity performance. Undoubtedly, equities and high-yield securities have had a really spectacular 3 years. Therefore, it is not surprising to see the index performing well.
Reading the Chart
Second, we have chosen an indicator for that chart — the Bollinger Band with a 200-day moving average and a 2-standard-deviation band. In that sense, the moving average is the 200-day simple moving average. The band around it represents 2 standard deviations from that moving average.
We have chosen that indicator because, in our opinion, it correctly captures market positioning. A rising moving average indicates positive momentum; a falling moving average, negative momentum. Wide bands indicate large capital reallocations; tight bands indicate a lack of capital reallocations.
We want you to draw your attention on the last 12 months. Since August 2025, the performance of the Total Return Index has been negative. Despite the fact that the average security in the index has a maturity of around 5 years and yields around 15% per annum, holders of such securities have not realized ANY returns over the last year. Even when taking coupons into account, returns were not realized.
Moreover, with the 200-day deviation band so narrow, that lack of positive return has not been accompanied by market volatility or a large credit event. Rather, it suggests a lack of new capital coming into the market.
High Yield Credit Spreads vs. Equities
We will now take a look at the same index, but instead of total return or effective yield, we will look at the spread — the interest rate over relevant US Treasuries. Below is a 30-year chart of the index spread. We will also put another chart just below it — a 30-year chart of the SPY ETF, both courtesy of TradingView.
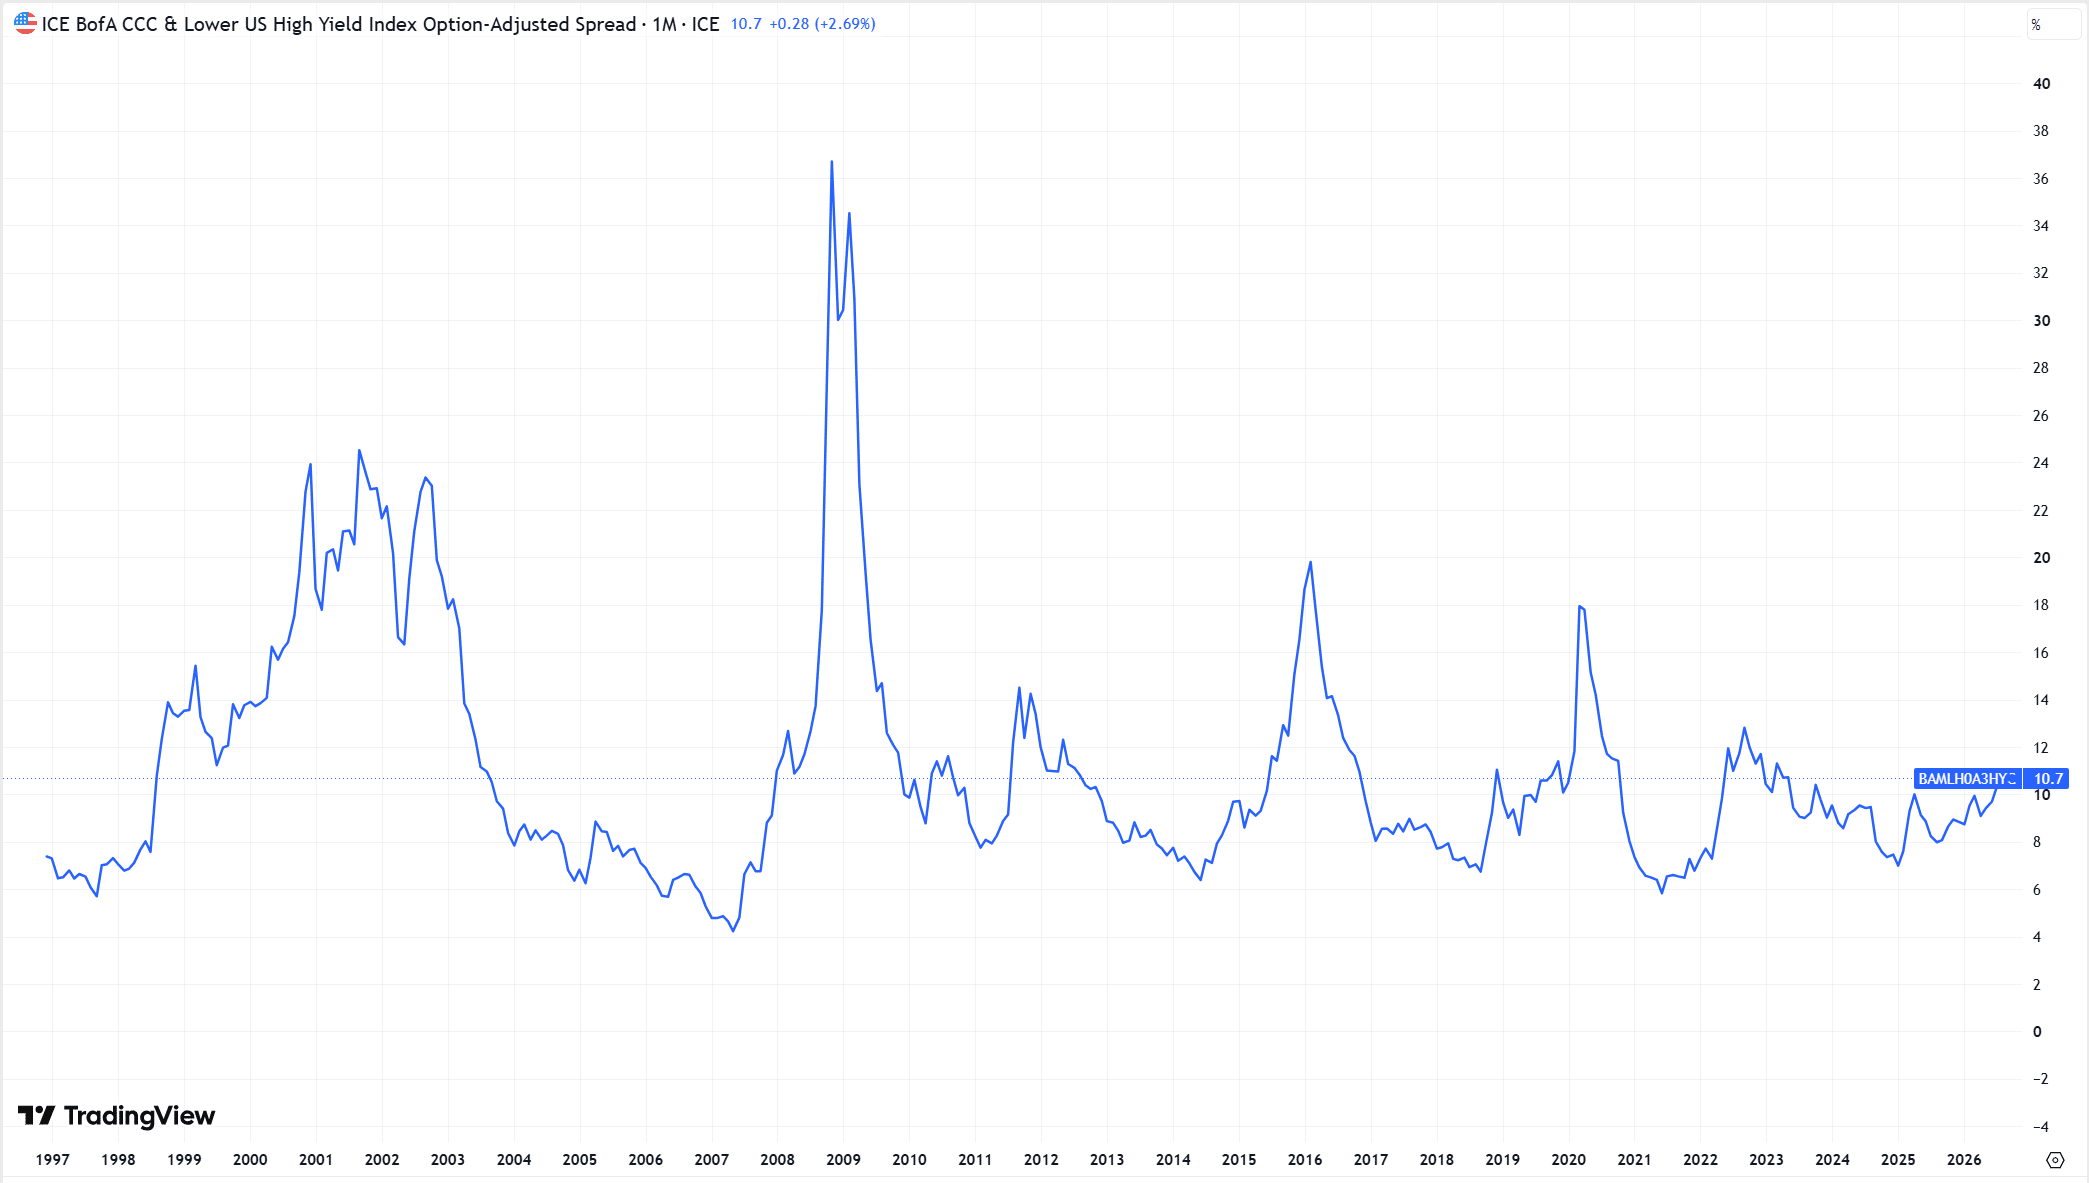
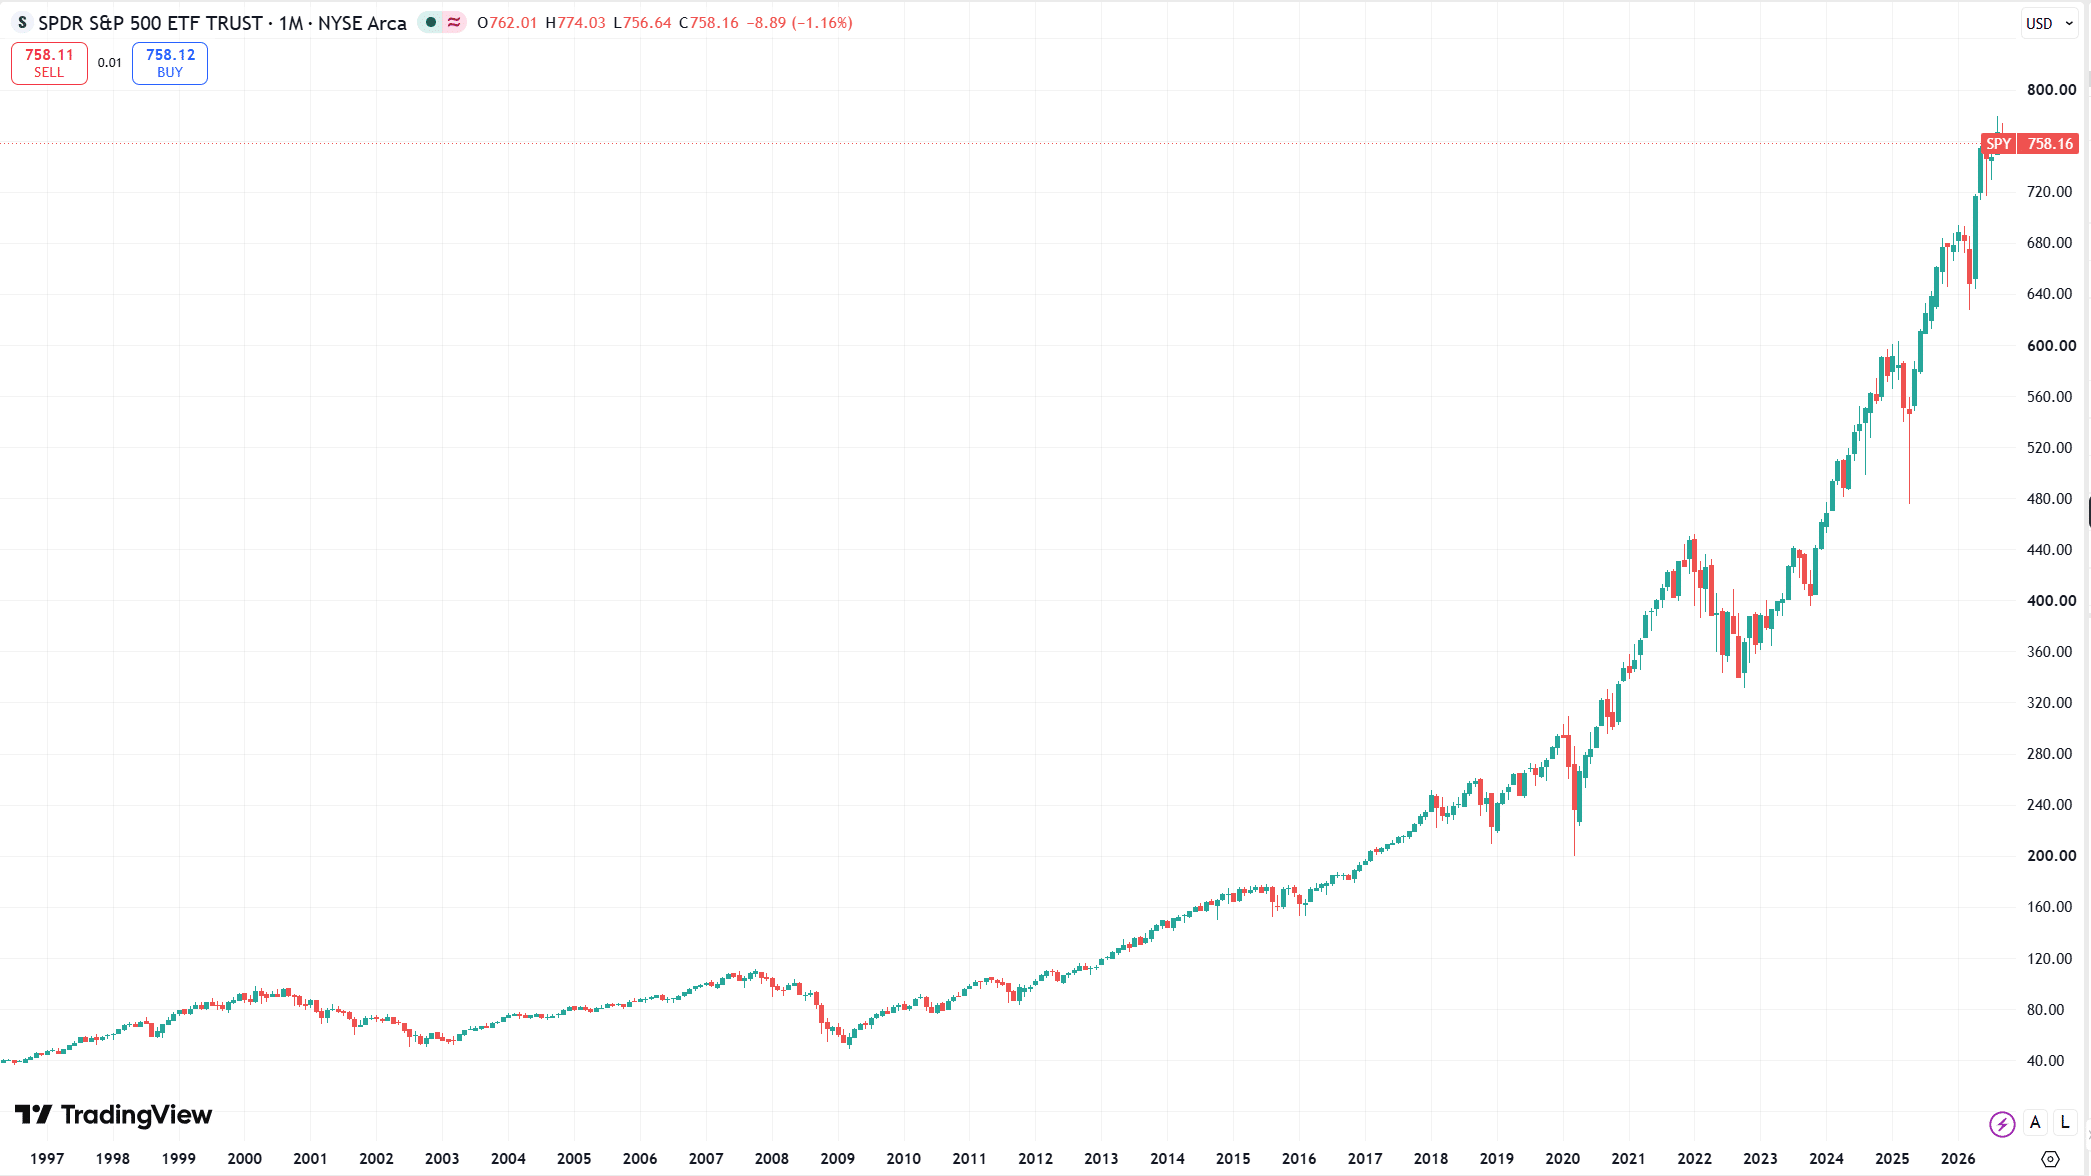
It is not as easy to see, but it is certainly true that the SPY ETF and high yield credit spreads are strongly negatively correlated. That means that higher readings of the credit spread index are associated with negative performance of the SPY ETF.
Correlation in itself does not imply dependence, but from the economic theory of the business cycle, we know there is a strong relationship. Readers who want the mechanics behind this relationship can find more in our guide to how the credit cycle drives equity markets.
What the two charts imply is that the really low credit-rating names — CCC and below — are already showing negative pricing dynamics. Usually, such credit contractions result in equity corrections.
Moreover, from a purely historical point of view, such large credit contractions occur every 5–10 years. Here are the last four: 2001, 2009, 2016 and 2020.
Yes, historically speaking, credit markets are due for a large correction that may already be underway. Usually, such a credit contraction results in a correction in equity markets.
However, that is what usually happens.
Could this time be different?
Yes, of course it could.
But what if it is not different?
Disclaimer
The articles, podcasts, and newsletters from Alaric Securities OOD are classified as marketing communications. The views expressed are solely those of the individual authors affiliated with Alaric Securities OOD and do not necessarily reflect the views of the company, its subsidiaries, or affiliates. This content is provided for informational purposes only. It does not constitute investment advice, a recommendation, or a solicitation to buy or sell any security, digital asset (such as cryptocurrency), or other financial instrument. Third-party content is included solely for informational purposes and does not reflect the views of Alaric Securities OOD. All investments involve risk, including the possible loss of principal. Past performance is not indicative of future results. References to third-party companies, logos, or trademarks are used under fair use/fair dealing principles for analysis and commentary.
Stay Ahead with Alaric Securities Newsletters
Traders and investors don't need more information - they need better information. That’s what we deliver!
Step back from the daily noise. Each issue explores market trends, industry shifts, trading opportunities, and exclusive updates — learn what's shaping the markets, not just what's trending online. Ready to get the edge?