
BlackRock Inc Stock: Why Its Valuation Matters


Closer Look at the Leading Asset Manager’s Performance
BlackRock Inc stock is gearing up for its next earnings report on July 15, 2024, making it a great time to assess how well this financial giant is performing and how much it’s worth. With the ticker BLK, BlackRock Inc is the most significant global asset manager by assets under management (AUM), a remarkable feat for a company established just 36 years ago.
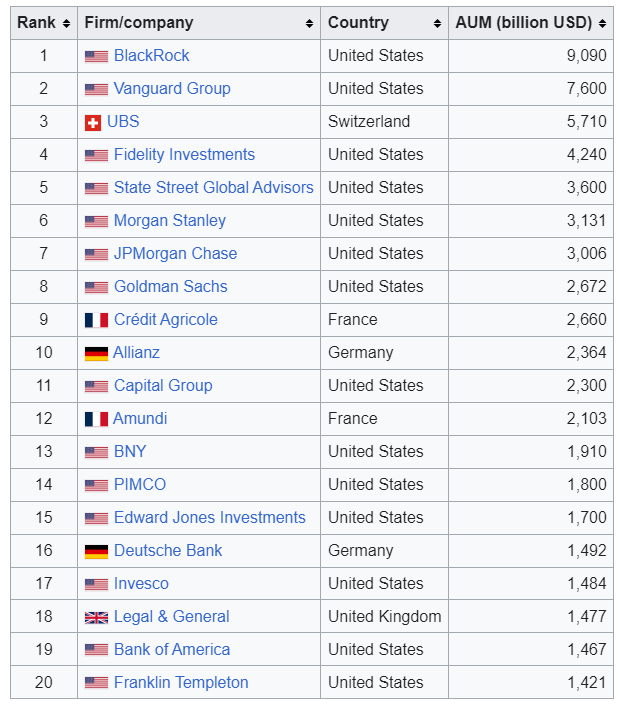
*List of the top 20 asset managers in the world (as of 2023), ranked by total assets under management (AUM). Source: Wikipedia
Yes, BlackRock Inc is the Godzilla of the asset management industry, easily surpassing most other asset managers that have existed much longer.
To take that title, BLK needs to be innovative and well-run.
Valuation Overview
| Index | S&P 500 | P/E | 20.63 |
| Market Cap | 120.66B | Forward P/E | 17.41 |
| Income | 5.92B | PEG | 1.64 |
| Sales | 19.15B | P/S | 6.3 |
| Book/sh | 267.04 | P/B | 3.04 |
| Cash/sh | 63.08 | P/C | 12.87 |
| Dividend Est. | 20.43 (2.52%) | P/FCF | 30.45 |
| Dividend TTM | 20.20 (2.49%) | Quick Ratio | – |
| Dividend Ex-Date | 7-Jun-24 | Current Ratio | – |
| Employees | 19800 | Debt/Eq | 0.29 |
| Option/Short | Yes / Yes | LT Debt/Eq | 0.04 |
| Sales Surprise | 1.51% | EPS Surprise | 4.36% |
| SMA20 | 3.70% | SMA50 | 3.84% |
** Source: Finviz
We are not going to go into great details about the valuation. We are only going to compare it to SPY, S&P500 Index ETF, XLF, S&P500 Financial Sector ETF and XLY, S&P500 Consumer Cyclical ETF.
| Name | Description | Forward PE | Earnings Growth | PEG Ratio | 10 Yr Annual Return | YTD Return | 1M Return |
| SPY | S&P500 | 23,04 | 16,30% | 1,41 | 12,55% | 11,25% | 4,94% |
| XLF | Financial Sector | 15,99 | 14,00% | 1,14 | 10,82% | 11,08% | 3,14% |
| XLY | Consumer Cyclicals | 24,8 | 13,55% | 1,83 | 11,66% | -1,42% | 0,26% |
| BLK | BlackRock Inc. | 16,99 | 12,61% | 1,35 | 9,80% | -1,62% | 3,10% |
XLY and S&P500 Consumer Cyclical ETF may not appear logical initially, but their purpose will become apparent later. Please bear with us.
BLK’s Valuation in Context
From the table above, one can see that BLK’s valuation is quite normal—very similar to most stocks included in XLF and, as such, with a similar valuation. One attractive characteristic of BLK is that it is down YTD, which might mean that initiating a long position in the stock could be less risky than buying SPY or XLF, given that both ETFs are up about 11% YTD each.
However, this is not why we focus on BLK. Due to its large share of assets, BLK is technically a financial company widely recognized by many retail and institutional investors.
Such companies, which have established brands like those in XLY, Consumer Cyclicals ETF, including Nike (NKE), Coca-Cola (KO), and McDonald’s (MCD), tend to trade at much higher PE ratios than most companies. KO, for example, trades at a 21 Forward PE Ratio while its growth history and prospects for future growth are much worse than those of BLK.
We are not necessarily saying that BLK deserves those multiples; we are just saying that BLK deserves a premium valuation relative to the financial sector as it is the undisputed king of the asset management industry.
Market Performance and Consumer Confidence
Moreover, assets under management and asset managers’ profitability correlate with positive market performance and high consumer confidence. While global equity markets are doing quite well over the last two years, consumer confidence is shallow.
Please see below the 10-year history of the University of Michigan Consumer Sentiment:
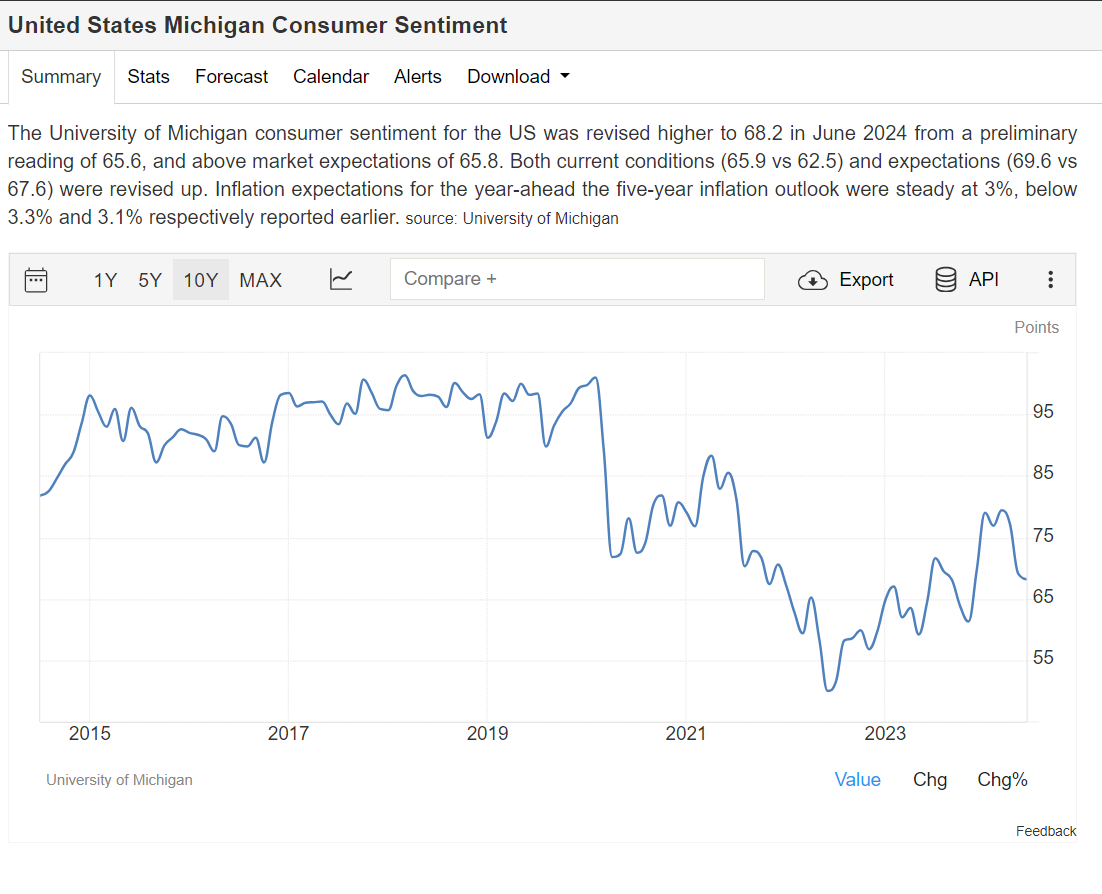
As you can see, while global equity markets are trading at new highs, nearly double the S&P500’s 2020 lows, consumer sentiment is worse than at the 2020 lows.
Future Growth Prospects for BlackRock Inc Stock
We believe that solid equity markets and the impending lowering of global rates, especially in the US, will catalyze more inflows into asset managers as confidence is expected to improve and the attractiveness of bank deposits decreases.
Analysts expect BLK’s earnings to grow less than those of the S&P 500. On a 5-year basis, BLK’s earnings are expected to grow 12.61%, while those of S&P500 are expected to grow 16.30%. We believe that estimate to be a very conservative one. Given the premier position that BLK finds itself in, we think the company can experience growth close to that of the S&P500.
Moreover, the current forward PE Ratio for BLK of 16.99 does not give enough credit to the company. BLK is quite a valuable brand. BLK’s PE valuation premium to XLF should be at least 25-30%. If XLF’s forward PE ratio is 16, then BLK’s forward PE valuation is about 20 or 15% higher than the current market price.
Timing the Trade: When to Enter
That brings us to the timing of the trade—when do we enter? The company is expected to report earnings on 15th of July. Should we wait for earnings or not?
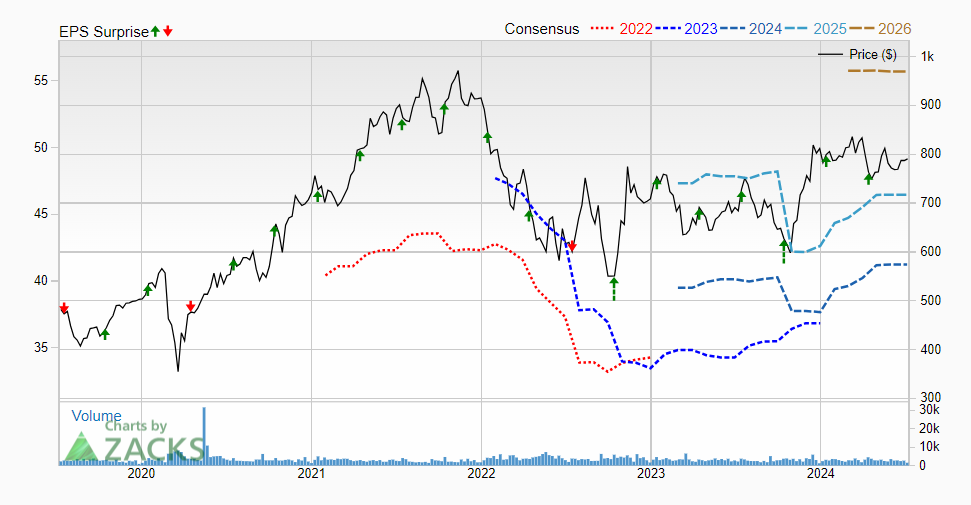
Pictured above is the 5-year price chart of BLK, courtesy of zacks.com, where green and red arrows indicate positive earnings surprises and negative earnings surprises, respectively. BLK has beaten earnings expectations 17 out of the last 20 times.
The average miss was around 3% vs. expectations, with the worst 7% lower earnings performance in July 2022. In the meantime, when the company surprises, it usually surprises by 10%, with the most significant positive surprise occurring in October 2022, when the company beat expectations by 24%!
Buying the stock ahead of earnings could be risky. However, given the conservative valuation, improving prospects, and history of big positive surprises on earnings announcements, we believe risk is justified.
Get the trading edge you need in today’s markets – sign up for our monthly newsletter featuring in-depth expert analysis, hot market insights, and exclusive trading strategies.