
Conflict in the Middle East: Beyond the Obvious


Looking at Military Resources and Market Signals
The conflict in the Middle East creates significant uncertainty for markets and policymakers. When tensions escalate, many assume that anything can happen. However, markets constantly interpret available information.
We do not claim military expertise, nor do we have information that markets lack. Still, we can recognize patterns. Pattern recognition helps connect data that may seem unrelated. In this case, two signals help interpret the situation: military budgets and market expectations.
Pattern 1: Military Budgets
Why Resources Still Matter in War
First, military power depends on resources.
According to TradingEconomics, Iran’s GDP in 2025 reached about $463 billion. Iran spent roughly $7.9 billion on its military. That equals about 1.8% of GDP. As a result, Iran relies heavily on asymmetrical warfare. Its strategy emphasizes quantity rather than technological sophistication.
By contrast, the United States spends far more. In 2024, the U.S. military budget reached about $869 billion, or roughly 3.3% of GDP.
However, military spending does not determine every outcome. Smaller forces sometimes challenge stronger opponents. In most cases, though, outside support plays a decisive role.
Ukraine provides a recent example. In 2021, Ukraine spent about $6 billion on defense, while Russia spent roughly $65 billion. Ukraine resisted the invasion largely because of military aid from the United States and Europe. Without that support, sustaining an effective defense would have been far more difficult.
History shows similar patterns. During the Vietnam War, the Viet Cong received significant military support from the Soviet Union. External backing helped sustain their resistance.
External Support and Strategic Balance
The gap between U.S. and Iranian military spending remains enormous. Without outside support, Iran cannot match U.S. military capacity.
Russia could theoretically provide assistance. However, Russia remains heavily engaged in the war in Ukraine. As a result, China stands out as the only major power able to shift the balance.
If China does not step in, the imbalance strongly favors the United States. War always involves uncertainty. Nevertheless, military effectiveness still requires resources.
The United States does not need to occupy Iran to achieve its objective. If the goal is to force negotiations, the spending gap suggests that such pressure could succeed.
Pattern 2: Conflict Duration
At the same time, financial markets provide signals about expected risks.
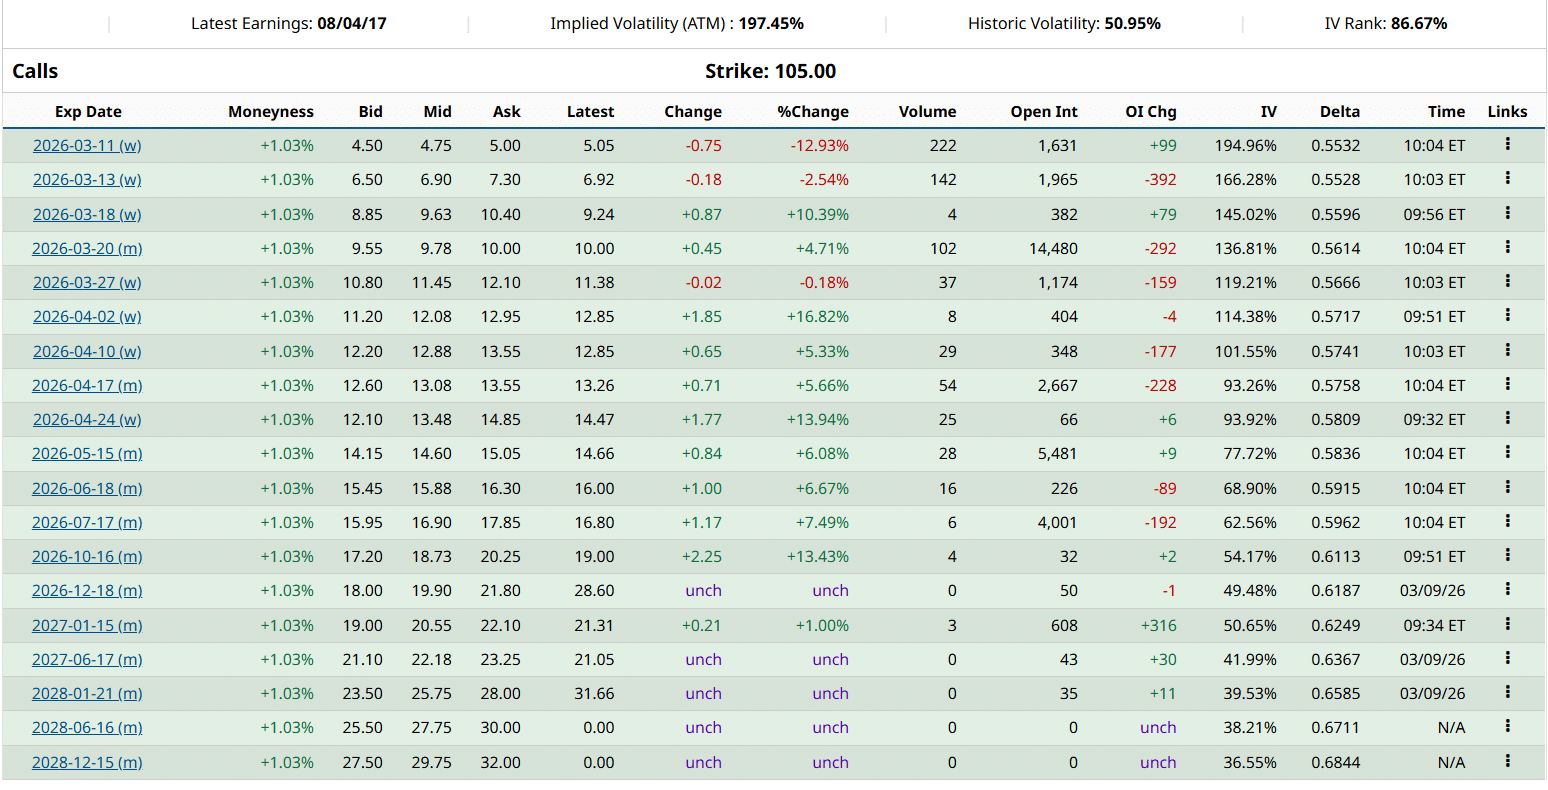
The chart above (courtesy of Barchart.com) shows at-the-money call options on the USO ETF, which tracks CME crude oil futures. These options have maturities between March 2026 and January 2028.
Implied volatility drops sharply after the April 17, 2026 maturity. This pattern suggests that traders expect higher disruption risk in the near term.
However, markets appear to price a decline in risk later in the year. This expectation does not necessarily mean that the conflict will end peacefully.
Instead, it suggests that markets expect the impact on oil deliveries to decline over time. Two developments could explain this expectation. First, diplomatic negotiations could reduce tensions. Alternatively, Iran may struggle to disrupt shipping through the Strait of Hormuz.
What Oil Markets Are Pricing
In our view, the regional military balance strongly favors the United States. Oil markets appear to reflect this assessment.
Current option prices on the USO oil ETF suggest that traders expect disruption to last roughly 60 days. This window extends into mid-April.
However, this estimate refers only to oil market disruption. It does not predict the duration of the conflict itself.
The conflict could last much longer. Nevertheless, markets currently expect its impact on oil flows to fade after the initial shock.