Start every trading day with a quick, actionable snapshot of global markets, key earnings, and the biggest movers across US, Europe, and Asia. Get the insight before your first coffee is gone.
April 3, 2026
How to Stop CFD Spreads From Eating Your Profits

Dilyan Fronov
Trading Expert

CFD traders pay up to 40 times more per trade than DMA traders. You don’t see it? There’s popup, no fee disclosure. The cost is buried inside the price itself — hiding in the CFD spread. And it’s been quietly draining your account on every CFD trade you’ve ever made.
What the Spread Actually Is
The spread is the gap between the price you can buy at and the price you can sell at.
So when you click buy, you pay the higher number. When you click sell, you get the lower number. The difference is the spread. And it always works against you. The second you enter a trade, you’re already in the red. Not because the market moved. Because the two prices were never the same to begin with.
In a real, fair market, that gap is tiny. A penny on Apple. A few cents on Tesla. Sometimes less.
But on a CFD platform, the spread isn’t real. Instead, the CFD broker pads it. The CFD broker takes whatever the actual market gap is, adds a few cents on top, and shows you the inflated version. That extra padding is a hidden fee — disguised as a price, so you don’t see it as a fee at all.
The Apple Example
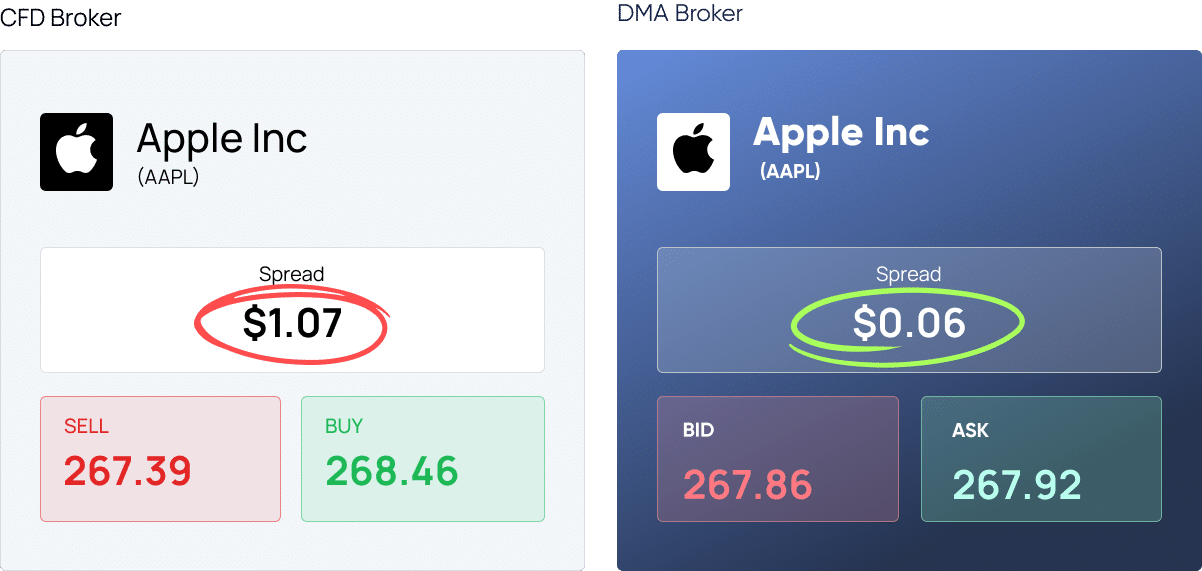
Two traders click buy on 100 shares of Apple at the exact same second.
The DMA trader pays the real market spread: $0.06. Total cost to enter: $6.
Meanwhile, the CFD trader sees a $1.07 spread on the same stock at the same moment. Total cost to enter: $107.
So the CFD trader just paid roughly 18 times more to do exactly the same thing as the DMA trader. And on tighter-spread stocks — the ones a CFD broker has to mark up the most — that multiplier climbs all the way to 40x.
The CFD trader isn’t in profit until Apple moves 0.40% in their favor. Meanwhile, the DMA trader is already up after a 0.02% move.
That’s not a small gap. In fact, that’s the difference between a winning month and a losing one.
(Spreads as of April 17, 2026. Real numbers vary with market conditions.)
The Math
One trade, $101 lost to the spread, sounds like the cost of doing business. But CFD traders don’t trade once. So let’s run the math you actually live with.
Now, ten trades a week at $107 spread cost? That’s $1,070 every week. Gone before a single trade plays out.
Forty trades a month? That’s $4,280 the CFD platform extracts from you, no matter what you do. Win, lose, draw — the spread still takes its cut.
So now think about your account size. If you’re trading a $10,000 account and bleeding $4,280 a month into spreads, you’d need to make 40% just to break even. Forty percent. Every month. Just to stand still.
That’s why your strategy can be working and your account can still be shrinking. The CFD trader isn’t losing to the market. The CFD trader is losing to the gap their broker built into every quote.
Why CFD Brokers Charge You Like This
Because CFD brokers can. And because the alternative would cost them money.
CFD brokers don’t send your trades to a real exchange. Instead, they take the other side themselves. So when a CFD broker quotes you a wider spread than the real market, the CFD broker pockets the difference. It isn’t a charge they pass through. It’s pure profit going straight into the CFD broker’s P&L.
And the genius of the system is that you never see it. Your statement at the end of the month doesn’t have a “Spread Tax: $4,280” line. CFD brokers hide the number inside every entry and every exit price. So you feel the loss in your balance, but you can’t point to where it came from. Most CFD traders blame themselves instead. Some tighten their stops. Others sit out trades. A few even start changing the setup itself. But none of that fixes the actual problem, because the actual problem is the CFD platform.
The Fix is DMA Trading
The only way to stop a padded spread is to remove the padder. That’s what Direct Market Access does.
A DMA broker doesn’t take the other side of your trade. Your order goes straight to the real exchange. The price you see is the actual market price. The spread you pay is the actual market spread — the same one the hedge funds and institutions are paying. No padding. No fake “version” of reality. Zero invisible fees tucked into the quote.
So now you pay the $0.06 on Apple instead of the $1.07. That’s $101 per trade you keep instead of hand over to a CFD broker. Multiply it across the year and the difference is bigger than most CFD traders’ annual returns.
And a DMA broker bills you transparently. You see exactly what you’re paying. You know what comes out of your account and what stays in. Some DMA brokers go further and waive commission on stocks and options entirely, so the only cost left on the trade is the raw exchange spread itself.
That kind of visibility alone will change the way you trade.
Stop Funding Your CFD Broker’s Spread
The secret to a growing P&L isn’t just better entries. It’s better fills.
And Zero commission seems like a great deal — when it’s real. The problem is that on a CFD platform, “zero commission” is just the sticker on the front while the spread does the stealing in the back.
Now you’ve seen the math. So the question stops being “why isn’t my strategy working?” and starts being “why am I still on a CFD platform that drains 40% of my account every month — before I’ve made a single winning trade?”
You don’t need a better setup. A tighter stop won’t help either. What you really need is a broker that quotes you the real price — and yes, real zero commission to go with it.
Switch to a DMA broker. Pay the raw exchange spread. Keep what your strategy actually earns.
Switch to DMA.
Stay Ahead with Alaric Securities Newsletters
Traders and investors don't need more information - they need better information. That’s what we deliver!
Step back from the daily noise. Each issue explores market trends, industry shifts, trading opportunities, and exclusive updates — learn what's shaping the markets, not just what's trending online. Ready to get the edge?