
How to Choose Stocks: A 7-Step Guide


A Time-Tested Formula from a Professional
Picking the right stocks can be overwhelming with so many choices out there. This guide will simplify the process into 7 easy steps, showing you how to choose stocks that are likely to do well.
Step 1: Focus on Large-Cap Companies
In our experience, only large companies have adequate analyst coverage. A good example here would be NVDA and MRVL. While both companies are semiconductor stocks, NVDA has a market capitalization of 3 trillion USD, while MRVL’s capitalization is only 63 billion USD.
In the last 90 days, 62 stock analysts have provided updates on NVDA, while only 34 analysts have issued updates on MRVL. But the frequency of updates is not the only problem here.
On average, an experienced stock analyst covers around 10 stocks. As a semiconductor stock analyst, your primary focus is NVDA. A mistake in your assessment of NVDA could damage your reputation, regardless of how accurate your evaluations of the other nine stocks may be. Conversely, if you correctly analyze NVDA, your missteps with the others may be overlooked.
Quality and frequency of updates in any industry are adequate only for the industry-leading stocks. As a soft rule, we will use the IOO ETF. If a company is a constituent of IOO ETF, top 100 world stocks by market capitalization, we believe that the company has adequate analyst coverage.
Suppose the company is not constituent and market capitalization is less than 100 Bln USD. In that case, we believe the company might not have sufficient coverage and might be impossible or very difficult to value.
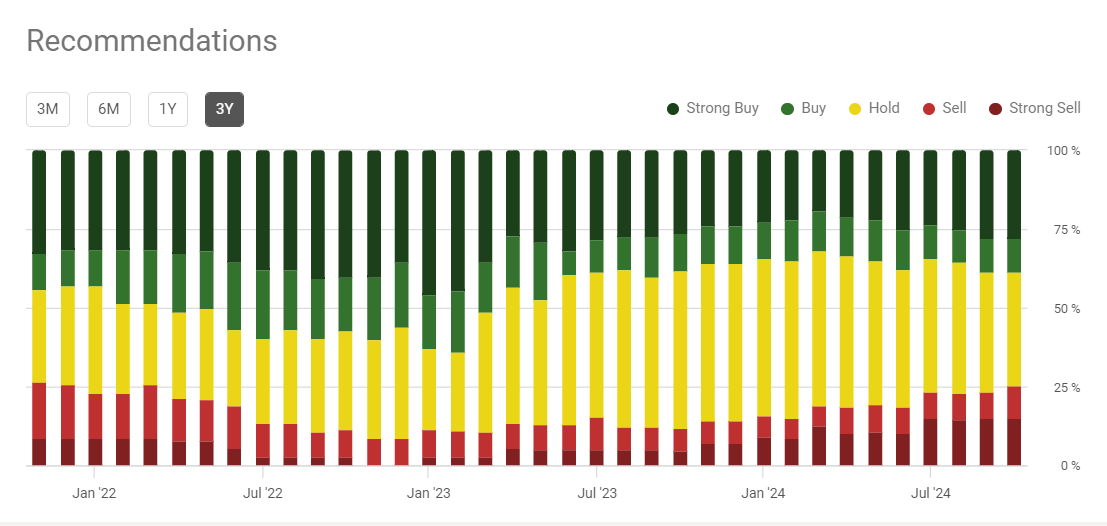
Step 2: Review Analyst Ratings
Over the last three years and at present, the stock should have had at least 70-75% Buy recommendations. To find those ratings, we use Seeking Alpha, but many brokerages nowadays keep track of analysts’ updates.
A good example here of a “bad stock” is TSLA:
An example of a “good stock” will be MSFT:
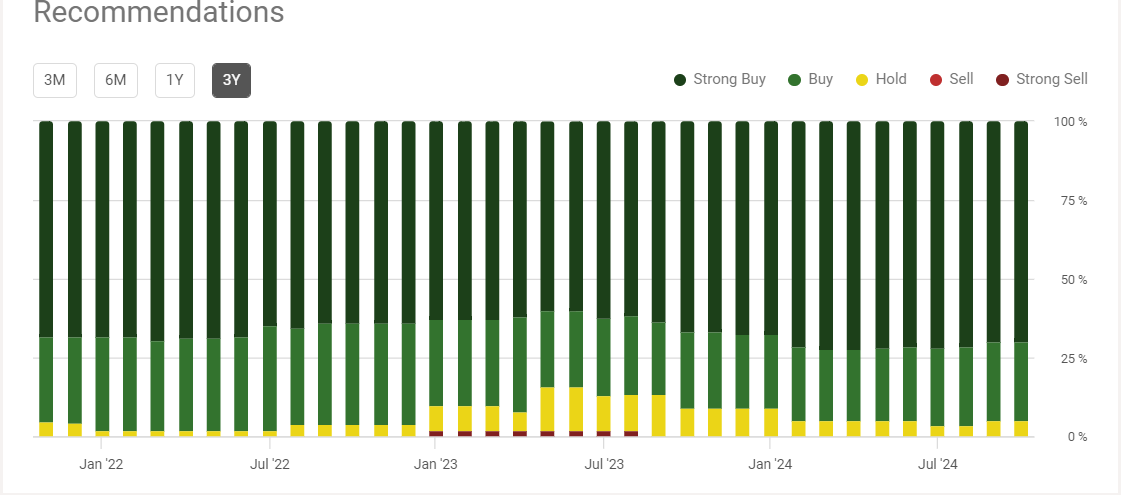
Ideally, for the stocks we buy, we want to see recommendations similar to those of MSFT, not TSLA.
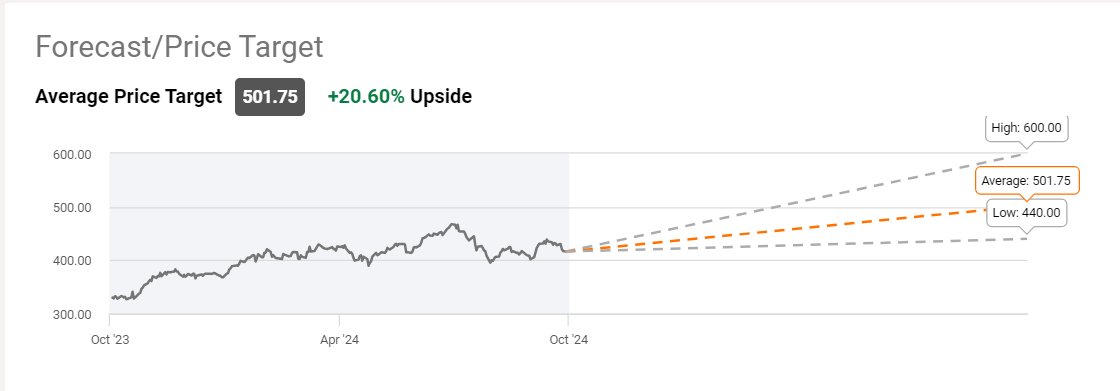
Step 3: Check Price Targets
The lowest analyst price target should not be much lower than the current price, and the average price target should be at least 20% higher.
Here is the Price Target of MSFT:
Step 4: Compare Forward P/E to Index
Compare Forward PE ratios (2025-2027) to S&P500 and/or the relevant index.
The important thing to keep in mind is that most stocks, even if above 100 billion USD in market cap, do not have earnings estimates beyond 2027. Some, like the Magnificent 7 stocks, do, but even for them, most analysts do not give earnings estimates beyond 2027. That is why we used that cut-off. We compare those forward PE ratios to market estimates.
Check the forward PE ratios for S&P500 and its 11 sectors, courtesy of State Street Global Advisors:
| Name | Description | 2024 PE | Earnings Growth | 2025 PE Ratio | 2026 PE Ratio | 2027 PE Ratio |
| SPY | 27,48 | 14,83% | 23,93 | 20,84 | 18,15 | |
| XLK | Technology | 30,15 | 15,87% | 26,02 | 22,46 | 19,38 |
| XLF | Financial | 15,54 | 12,99% | 13,75 | 12,17 | 10,77 |
| XLV | Health Care | 20,18 | 17,47% | 17,18 | 14,62 | 12,45 |
| XLY | Consumer Discretionary | 23,71 | 14,06% | 20,79 | 18,22 | 15,98 |
| XLC | Communications | 17,59 | 16,63% | 15,08 | 12,93 | 11,09 |
| XLI | Industrial | 21,53 | 13,78% | 18,92 | 16,63 | 14,62 |
| XLP | Consumer Staples | 20,54 | 7,92% | 19,03 | 17,64 | 16,34 |
| XLE | Energy | 12,22 | 5,52% | 11,58 | 10,97 | 10,40 |
| XLB | Material | 21,16 | 8,79% | 19,45 | 17,88 | 16,43 |
| XLRE | Real Estate | 35,81 | 5,57% | 33,92 | 32,13 | 30,44 |
| XLU | Utilities | 17,32 | 8,10% | 16,02 | 14,82 | 13,71 |
Generally, the benchmark for each industry varies; however, we are primarily seeking 2027 Forward P/E ratios lower than 18.
Benchmarking the Magnificent 7 Against Major Indices
Just an example, we will compare the S&P500 (SPY) and S&P500 Technology Index (XLK) to all the constituents of the Magnificent 7:
| Name | Sector | 2024 PE | Earnings Growth | 2025 PE Ratio | 2026 PE Ratio | 2027 PE Ratio |
| SPY | 27,48 | 14,83% | 23,93 | 20,84 | 18,15 | |
| XLK | Technology | 30,15 | 15,87% | 26,02 | 22,46 | 19,38 |
| AAPL | Technology | 33,9 | 30,60 | 27,09 | 21,64 | |
| AMZN | Consumer Discretionary | 39,46 | 32,15 | 25,44 | 21,29 | |
| GOOG | Technology | 22,07 | 19,39 | 16,80 | 14,42 | |
| META | Communications | 27,95 | 24,36 | 21,16 | 19,38 | |
| MSFT | Technology | 31,63 | 27,20 | 23,15 | 20,45 | |
| NVDA | Technology | 43,98 | 31,24 | 26,44 | 24,53 | |
| TSLA | Consumer Discretionary | 109,27 | 78,31 | 59,98 | 46,54 |
It is clear that only GOOG, out of all 7 stocks, is significantly cheaper than SPY or XLK. All other constituents of the Magnificent 7 are either valued similarly or more expensive than their benchmarks. This does NOT mean those stocks are short – rather than that, at present, their valuation is not as appealing as their benchmark, in this case, SPY or XLK.
Step 4, finding the appropriate benchmark index for each stock, is a key step. Stocks like BABA need to have a different benchmark, as otherwise, they might always look cheap, but for the Magnificent 7 stocks, the S&P500 seems an appropriate benchmark.
Step 5: Look for Insider and Institutional Ownership Rates Above 70%
Furthermore, as mentioned in our Market Insights series, institutional ownership rate is one of the most underutilized easily available statistics. Insider and institutional ownership rates should ideally be significantly above 70%.
For that step, we utilize finviz.com. Pictured below are the statistics for GOOG.
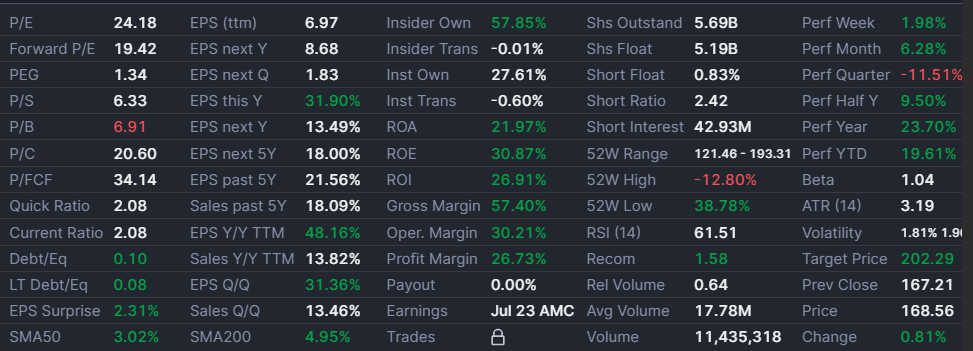
As you can see, Insider Ownership (57.85%) and institutional Ownership (27.61%) comprise 85.46%, keeping GOOG significantly above our desired rate of 70%.
Step 6: Look for an Average or Lower Short Float Percentage
The average stock in the S&P500 has a short float of around 1% of shares outstanding. In the case of GOOG, using the chart above, we can see that the short float is 0.83% of shares outstanding. A reading above 2% of shares outstanding is a cause for concern, but a reading above 5%, in our opinion, could be so significant as to cause us to abandon our long idea. The example here is META in 2022-2023:
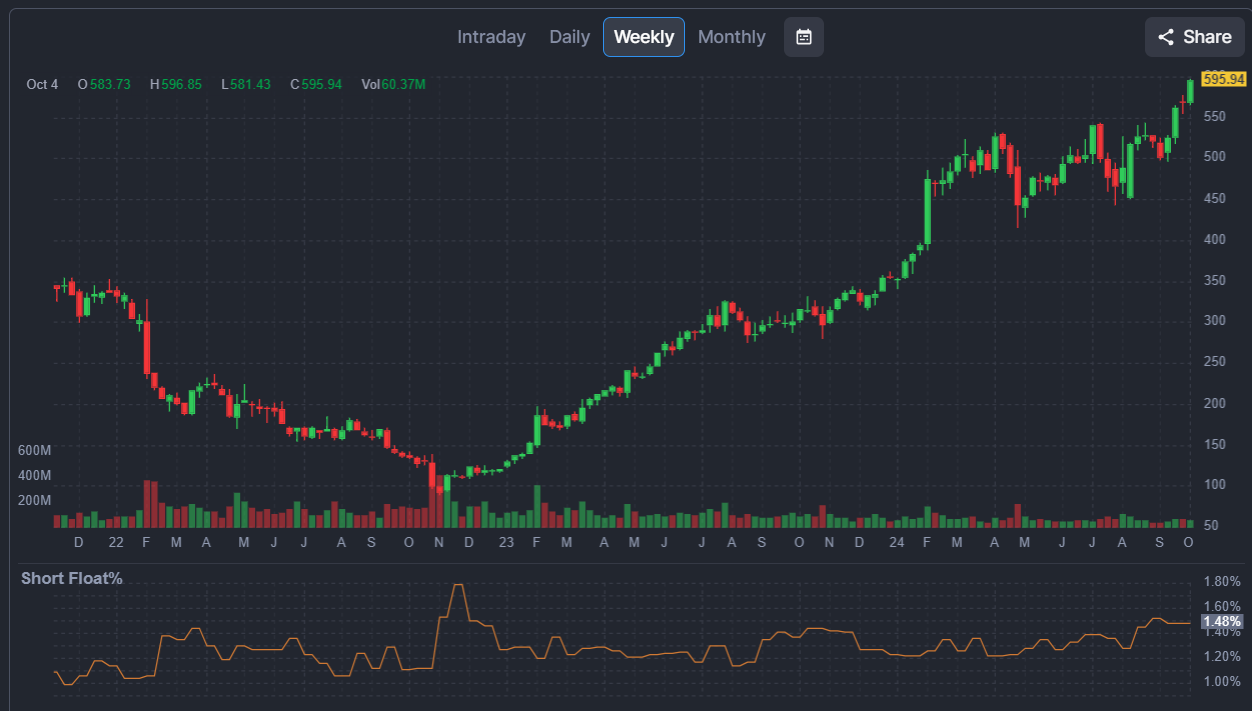
Even though in 2022 META dropped from 350 USD per share to below 100 USD, the short float never exceeded 2% and, for the most part, averaged only slightly above 1%. Yes, many people were skeptical of META, but very few believed the stocks had a big downside.
Step 7: Validate Business Model (5-7 Years of Existence)
We acknowledge that Step 7 is somewhat subjective, yet we believe it is crucial. The lack of widespread institutional investment in NVDA isn’t solely due to its high valuation. Instead, institutions tend to avoid NVDA because its competitive edge hasn’t been proven over time.
A clear example is AAPL. While AAPL introduced the iPhone in 2008, it wasn’t until 2015 that Mr. Buffett began buying shares in the company, indicating that he waited to see whether AAPL could maintain its dominance in the market.
That is because it took about 5-7 years for AAPL to prove its product was superior, and competitors could not easily threaten its dominance in the mobile phone market. Yes, NVDA is dominant in its market segment, but that dominance has not yet been tested. That is why most market participants, ourselves including, are reluctant to bet too much on NVDA.