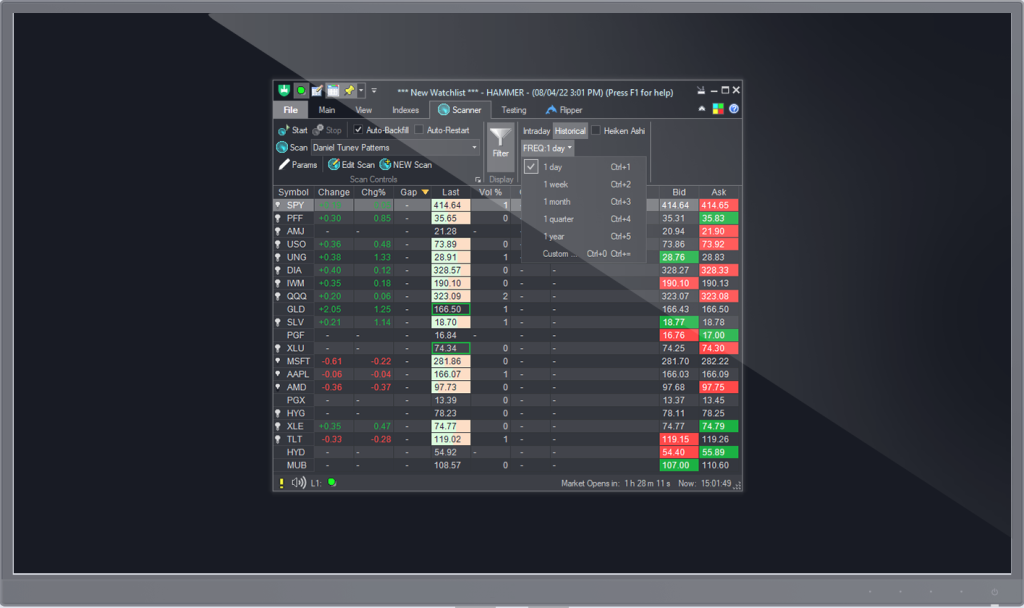
In Hammer Pro, you have the ability to create a customized portfolio scanner based on various criteria that align with your preferences and your trading system’s requirements. However, please note that currently, the scanner is available only for symbols that you have pre-added to your watchlist.
The scan executes, for each row in the portfolio, a mathematical formula involving the symbol’s parameters and technical indicators calculated for that symbol. This happens continuously, as new data comes in.
The scan, for each row, produces a Scan Result displayed in the portfolio and can be used to sort the portfolio or show/hide some rows. You can use all the indicators that Hammer Pro supports in the scans and make scans of your own. For example, you can scan through the portfolio for stocks that fit the “Death cross” pattern (50-day moving average crosses down 200-day moving average) or get alerted when the stock price touches the Bollinger bands (either upper or bottom line), etc. Hammer Pro can help you scan in real-time through stocks by parameters that match your own personal strategy.
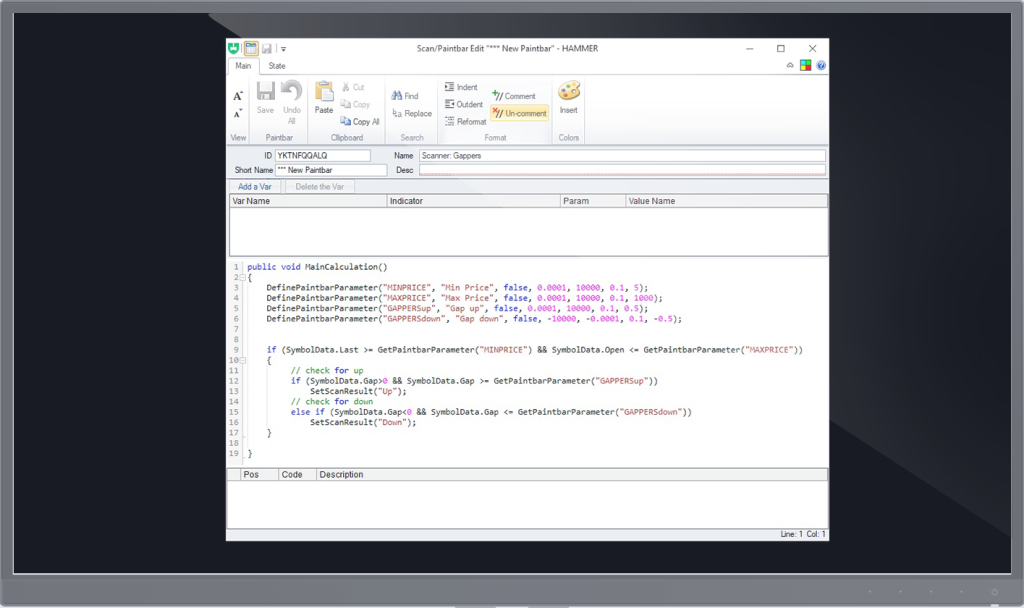
Advanced Scanners
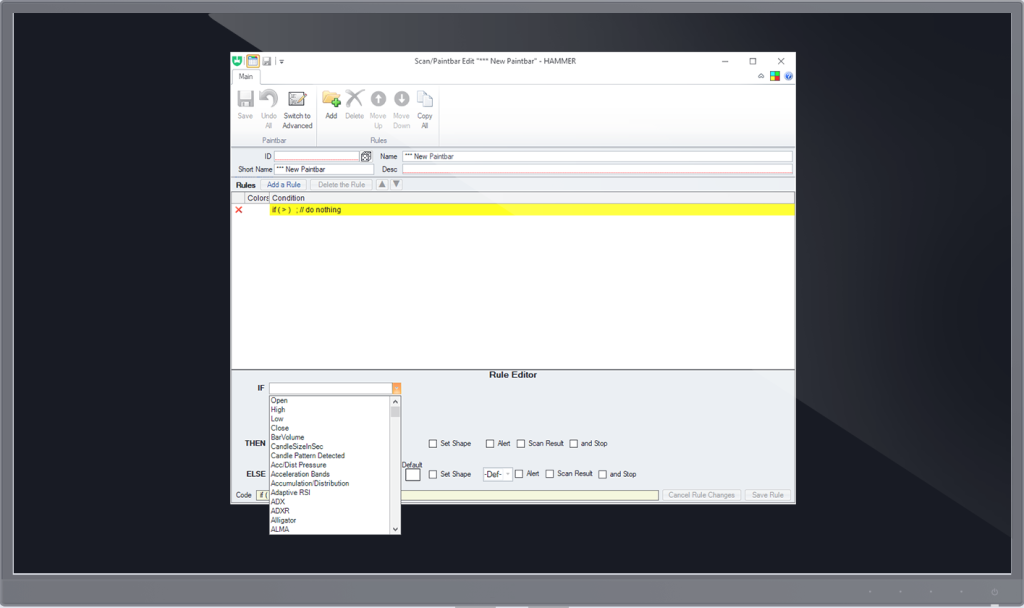
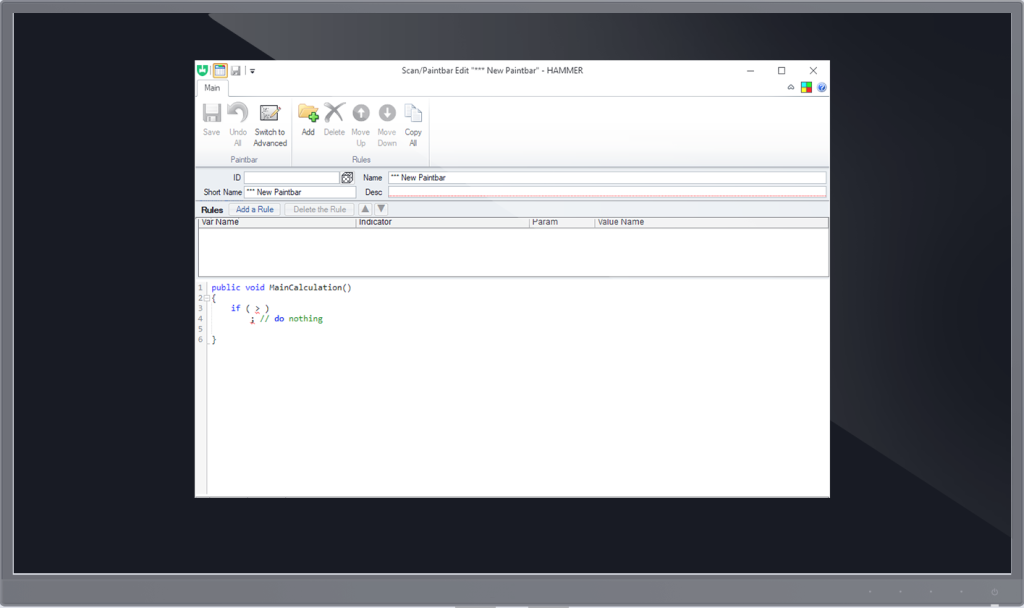
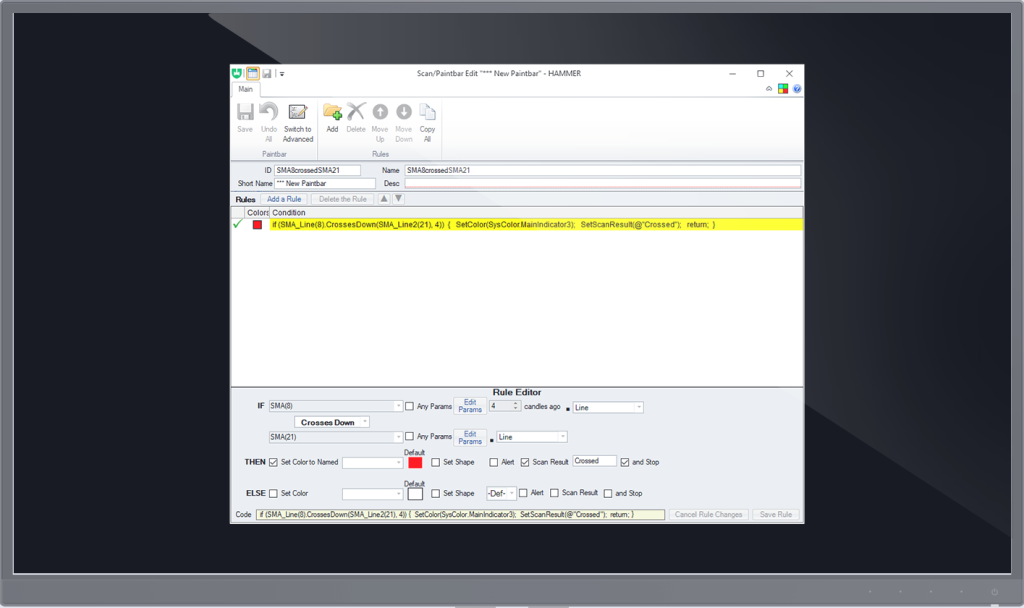
If you can’t find what you need in our built-in list of scanners, just switch to Advanced mode and you can utilize your coding skills as well. The scans are fully customizable and can be rewritten by you in C# code. You can create the exact rules by which Hammer Pro can scan stocks and match your professional strategy.
The scan can be applied to any portfolio from the Scanner tab on the portfolio. You can run the scan through any time frame that suits your style.
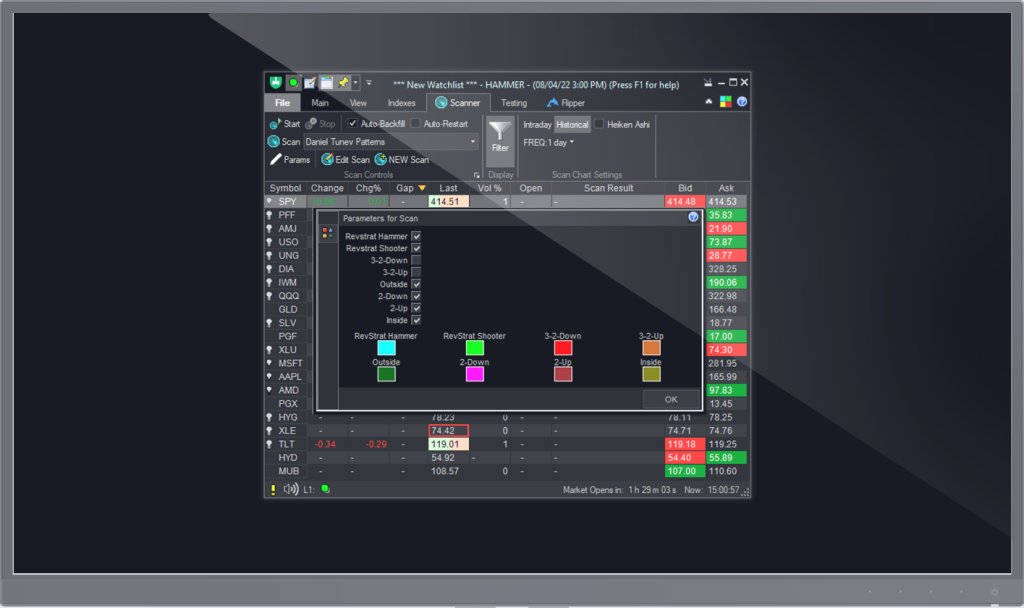
By setting up your scanner to search for Inside bars you can narrow down the list of stocks on your watch list to only those that show signs of a potential breakout.
Or if you have a broad range of investments you can easily go through all of them and see which ones are expected to do nothing for the time being. This can be checked on all desired time frames including custom ones of your preference.
Most Popular Scanners
Predefined scanners
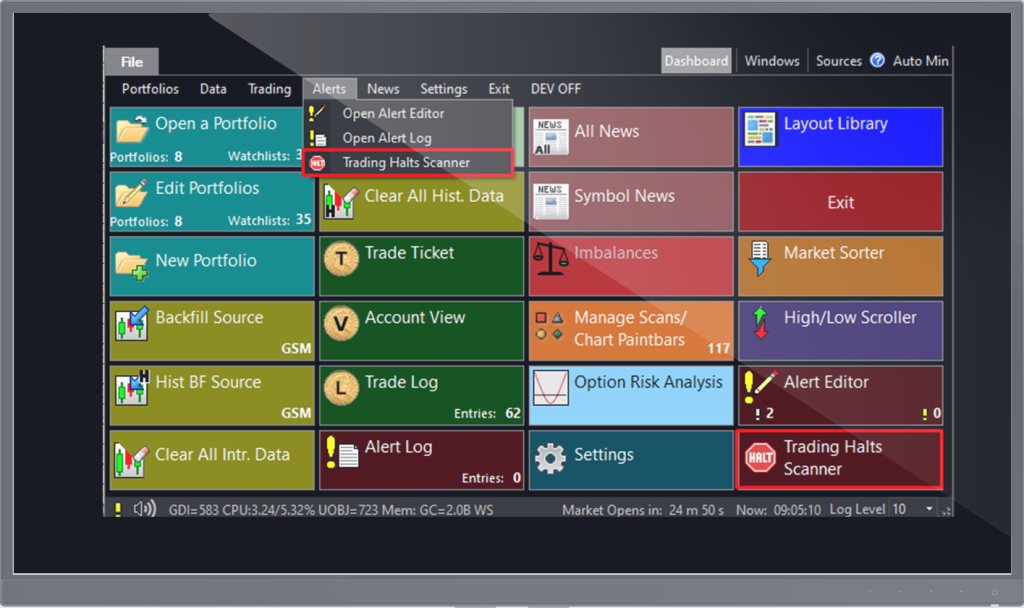
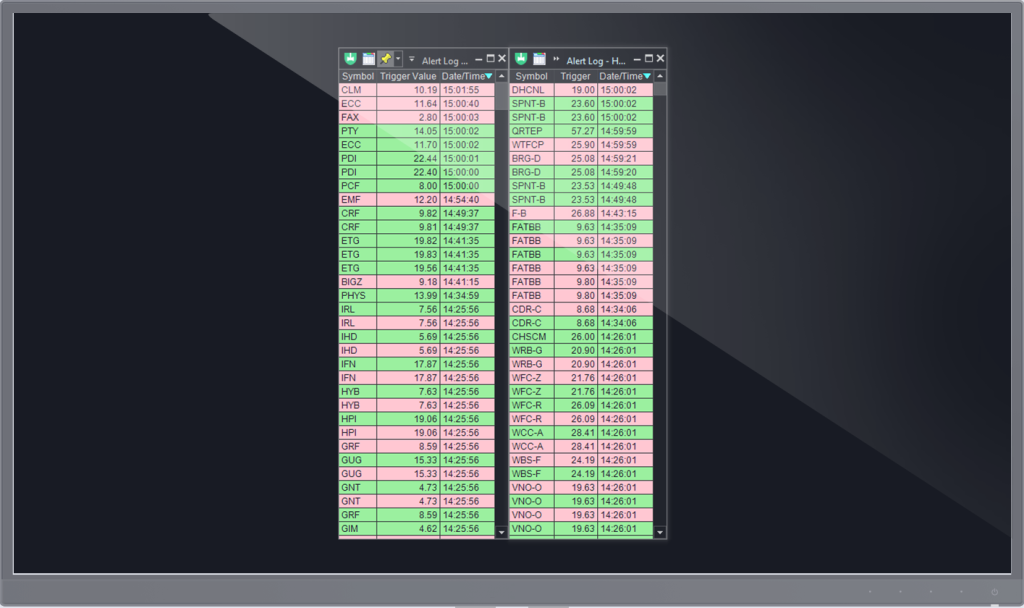
Trading Halts Scanner
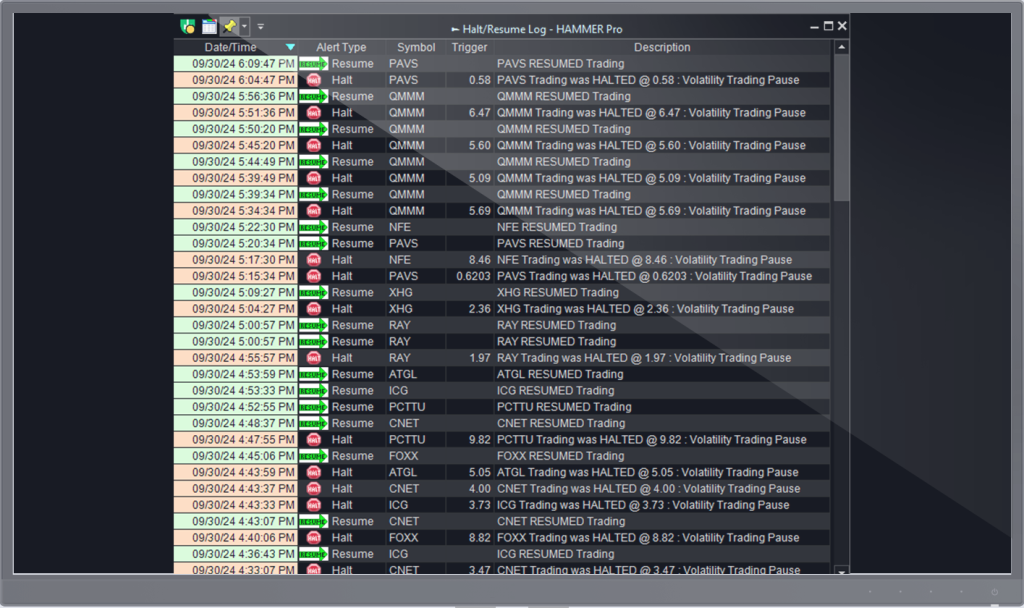
The Trading Halts Scanner gives you information regarding all halted stock listed on the US markets, the reason they were halted by the exchange and the price that triggered the halt.
Starting the scanner, you will see a list of all currently halted stocks. Throughout the trading day you will receive information live for all new halts and all the halted stocks that have resumed trading.
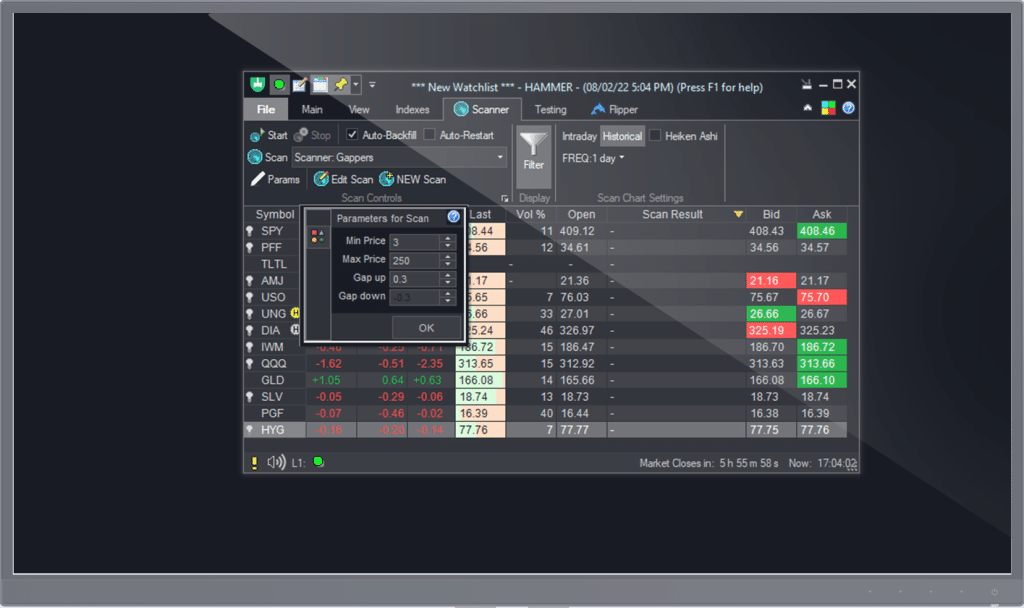
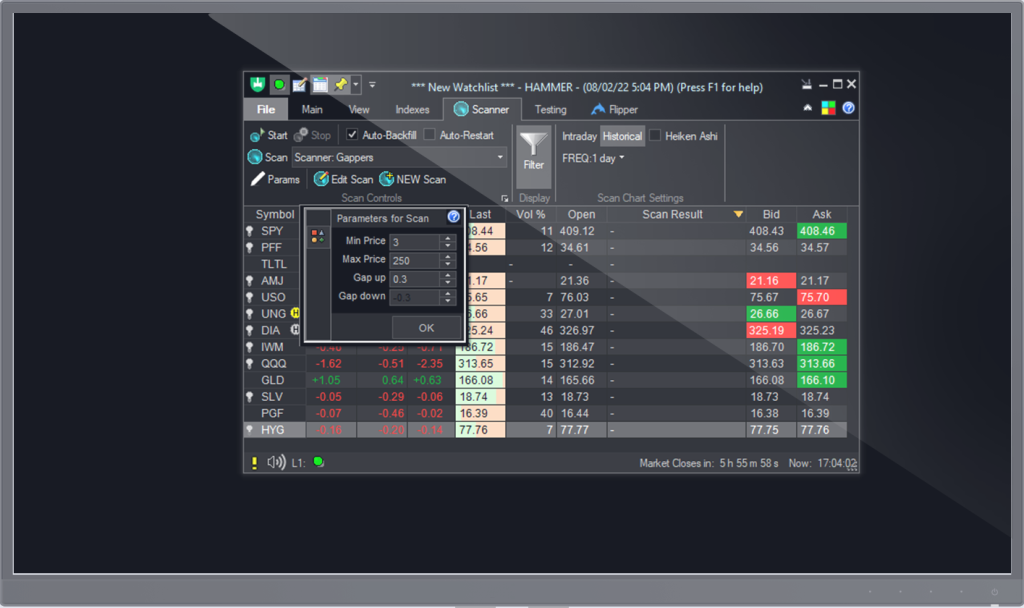
Gapper Scanner, Premarket Gap Scanner
Price Percent Change vs Previous close.
Price change (absolute amount) vs Previous close.
Unusual Volume
Percent Up
Minimum Bar Volume
Min Price
Max Price
Daily High/Low Scroller
Activates when the price approaches a predefined range of either the daily high or daily low.
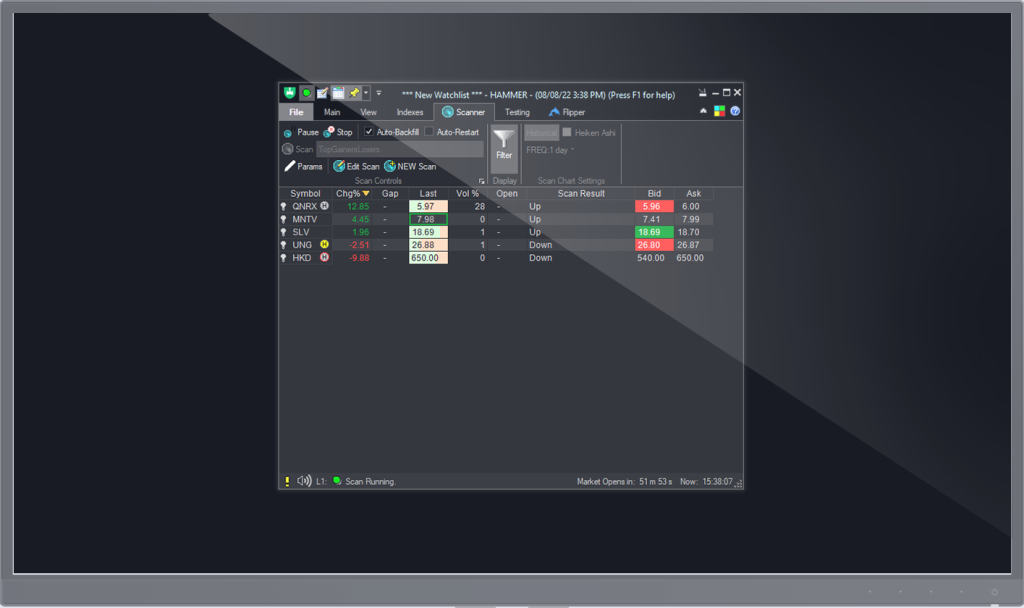
Top Gainers, Top Losers
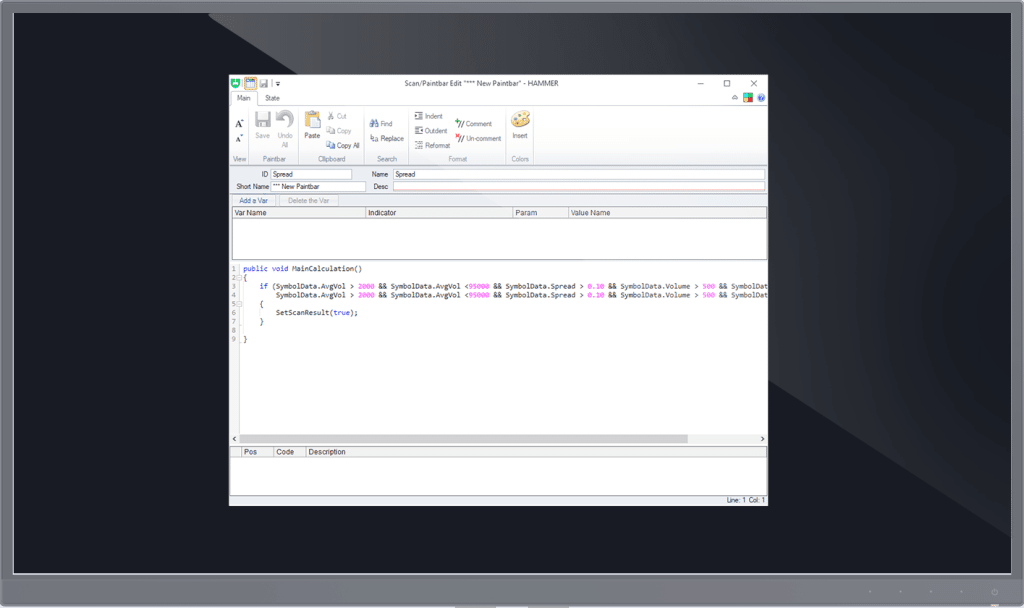
Advanced Scanners
Scanner SMA 8 day crosses down SMA 21 day
Between Average Volume Value, Spread
and Change for the day
Note: Select Historical time frame before you start the scanner
Example:Average Volume between 2000 and 95000, Spread is more than 0.10$ and Change price is more than 0.15$ for the day.
Note: If there are no errors means that the code working.
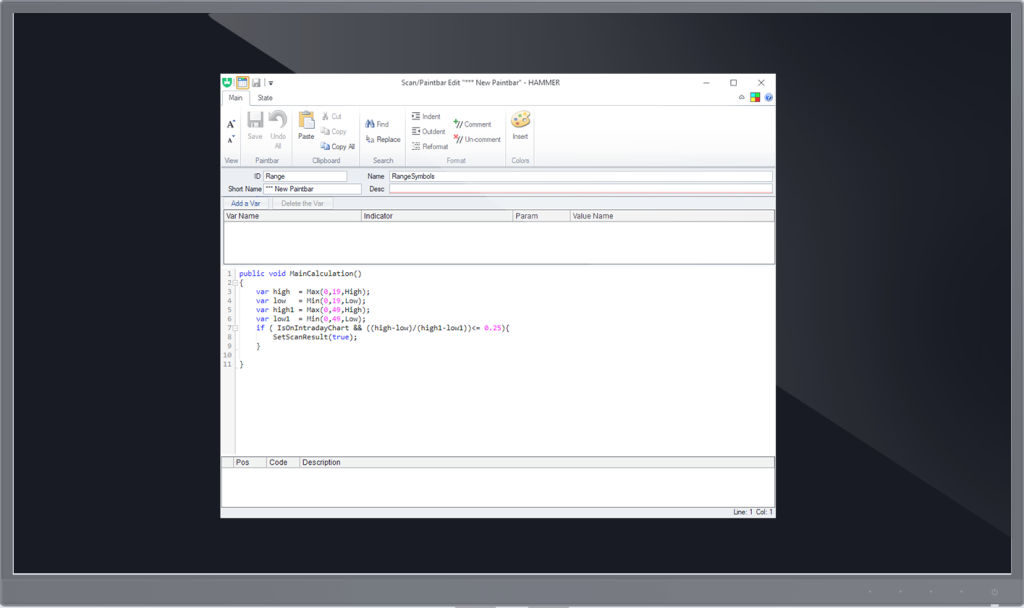
Imbalances scanner
Intraday range
Example: Imbalance Shares more than or equal 3500 shares and Imbalances Indication Change more than 0.15$ and same criteria but -0.15$ or less.
Example: The range for the last 20 min (high-low) to be less than or equal to 1/4 of the range for the last 50 min (high1-low1)