VIX Volatility Index Term Structure Explained

How to Spot Market Signals in Volatility Trends
It seems like the stock market is on everyone’s mind. That’s no surprise—in volatile markets, fortunes are made and lost as investors experience emotional highs and lows. Bold predictions, especially extreme ones, tend to dominate headlines. But the truth is, no one knows for sure what the future holds.
So, instead of forecasting the market, we focus on something more tangible: how we use the VIX Volatility Index and its term structure to inform our trading and investing decisions.
What Is the VIX Volatility Index
The VIX Volatility Index, often called the “fear gauge,” reflects the market’s expectations for near-term volatility based on options of the S&P 500. When the VIX is high, it typically indicates heightened investor fear and market uncertainty. Conversely, lower VIX levels usually suggest investor complacency.
Understanding the VIX Futures Term Structure
To gain deeper insights, we look beyond the spot VIX level and analyze the VIX Futures Term Structure — the relationship between current (spot) VIX and its futures contracts. This curve can help determine whether investors expect volatility to rise or fall over time.
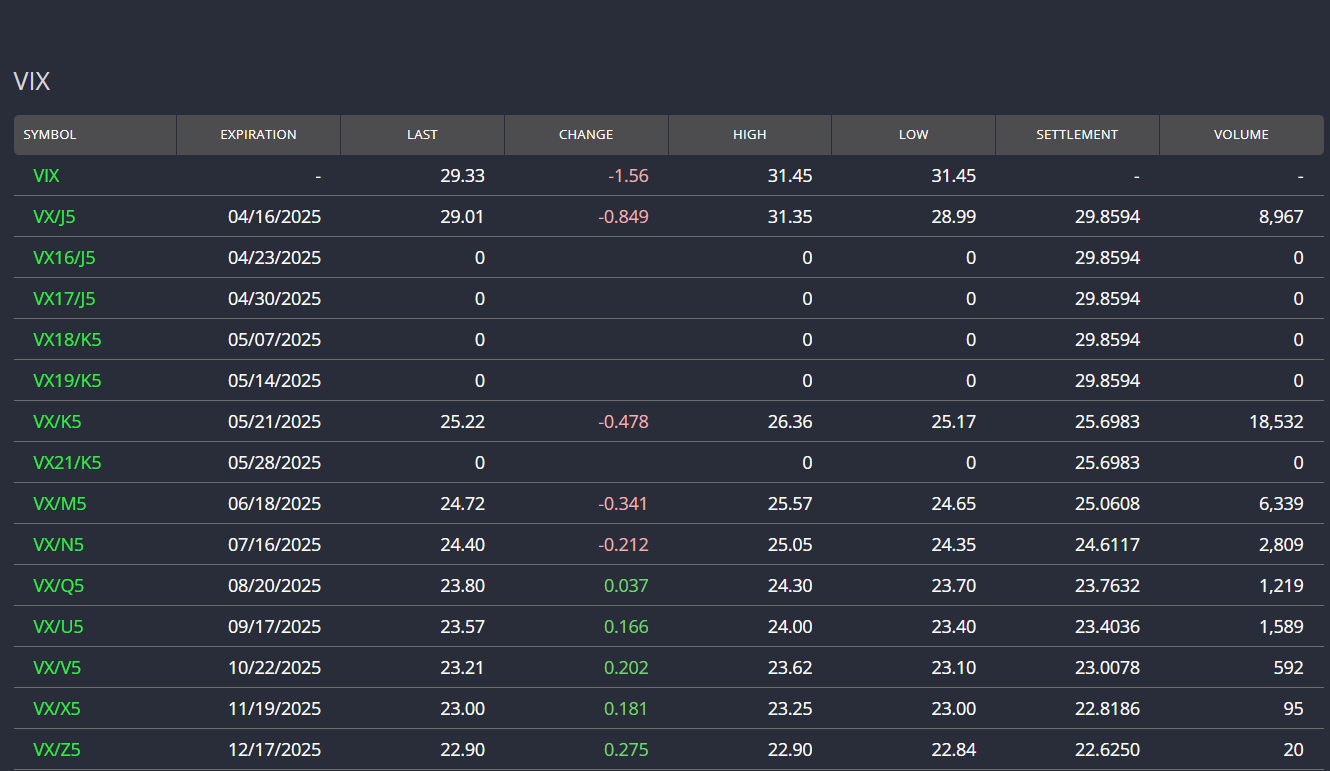
At the time of writing, the VIX Term Structure is inverted. That means short-term futures and the spot VIX Index are trading higher than long-dated futures. While this can be a red flag, it’s important to understand the context. For example, the current spread between the spot VIX (29.33) and the May 2025 futures (25.22) is roughly 20%. Compare that to July 4, 2025, when the spot VIX soared to 60.13, and the May Future sat at just 27.65 — a much wider spread of over 100%.
What the VIX Term Structure Signals About Market Sentiment
Historically, when the VIX spot index trades below its futures contracts, it’s often a signal that market conditions are stabilizing. While this is not an absolute rule, it is a statistically significant pattern. It can serve as a helpful gauge for when the storm might be passing.
In our approach, we look for the VIX spot to trade for several consecutive days below both the May and June 2025 futures, currently priced at 25.22 and 24.72, respectively. Although the spot VIX is still relatively high, this crossover could happen soon.
Following this signal doesn’t ensure we’ll buy at the bottom, but it does help us avoid catching a falling knife.
Applying the Strategy: Waiting for Calm After the Storm
By waiting until the VIX spot trades below both front-month and second-month futures, we give ourselves a more precise indication that fear may be receding. This is our green light to start considering using leverage or increasing market exposure — not a guarantee to do so, but a condition for reevaluation.
While this method means we might miss out on the absolute lowest prices, we prefer to step in when volatility appears to be tapering off rather than during chaos.
Pro Tip: Follow real-time VIX Futures data at CBOE VIX Futures
Final Thoughts: Risk, Reward, and Realism
Buying when prices are low is still one of the best strategies for long-term, unleveraged investors. But with potential reward always comes risk. Our VIX Volatility Index rule is not a silver bullet.
It won’t guarantee winning trades but provides a structured way to think about when the risk/reward balance becomes more favorable.
When fear begins to fade and the VIX Volatility Index dips below future expectations, that’s our cue to pay closer attention.