
Start every trading day with a quick, actionable snapshot of global markets, key earnings, and the biggest movers across US, Europe, and Asia. Get the insight before your first coffee is gone.
April 19, 2023 | Issue 22
What You Need to Know About VIX (CBOE Volatility Index)

Nikolay Stoykov
Managing Partner at Alaric Securities

We constantly hear from the media (CNBC, if you are a trader) around us about market sentiment. ‘Market sentiment is bad’ or ‘Market sentiment is good’ — we rarely get to hear more about what this sentiment is based on. And when we listen to what constitutes market sentiment, people practically all the time refer to VIX — ‘The Fear Indicator’, as their sentiment indicator.
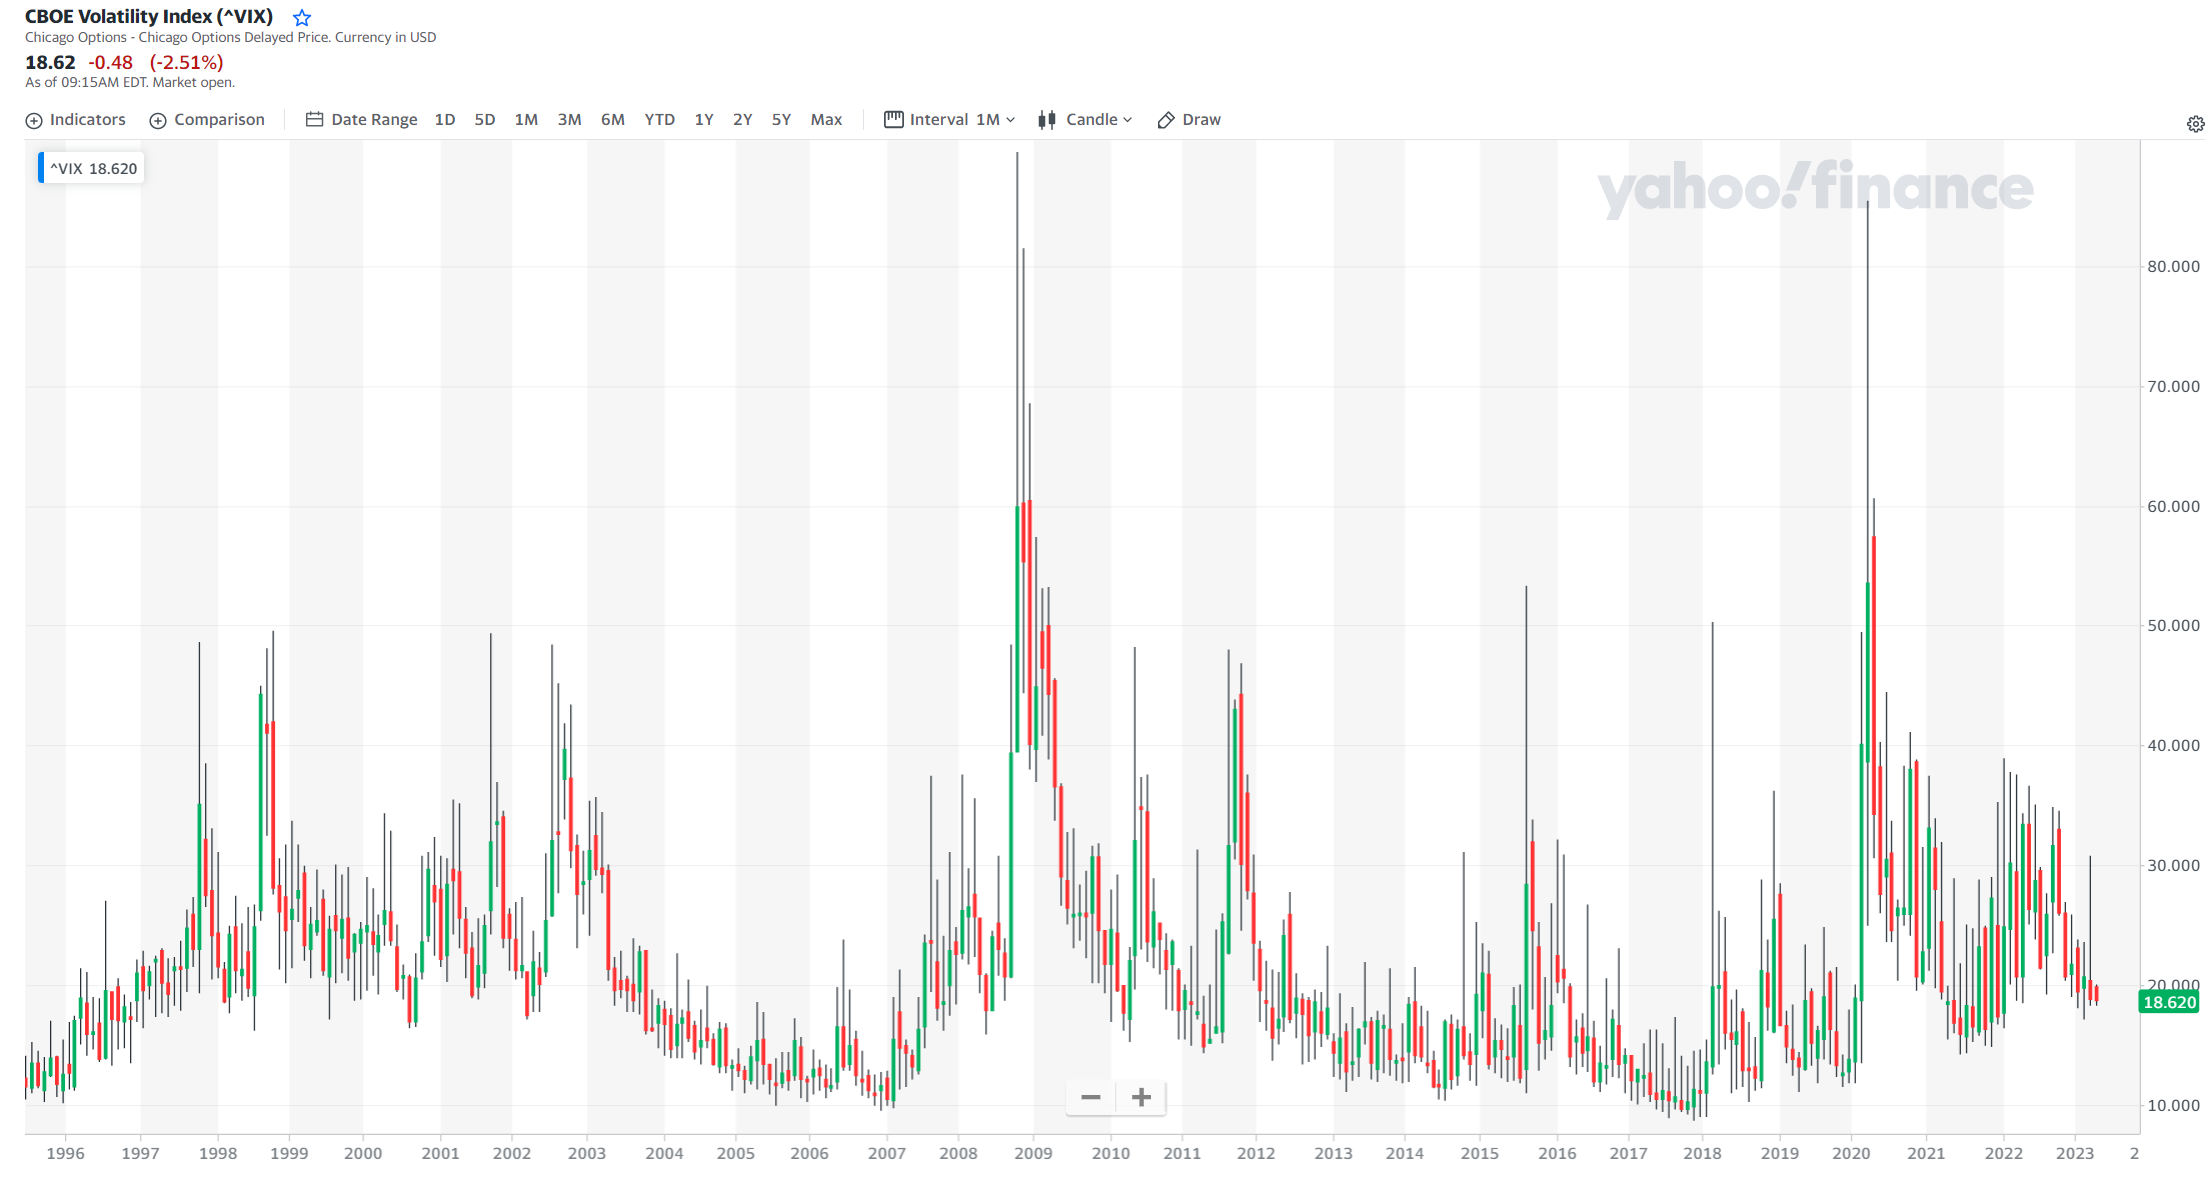
According to Wikipedia: The CBOE Volatility Index, or VIX, is a real-time market index representing the market’s expectations for volatility over the coming 30 days.
Isn’t it strange that VIX is actually a volatility index, not a sentiment index? However, the prevailing wisdom states, ‘Markets fall 3—4 times faster than they climb’. In that sense, when volatility occurs, it usually indicates a down move.
The statement above is USUALLY true but is NOT true all the time. Let’s have a look at VIX and S&P500 Index (on which VIX is based) SIDE BY SIDE:
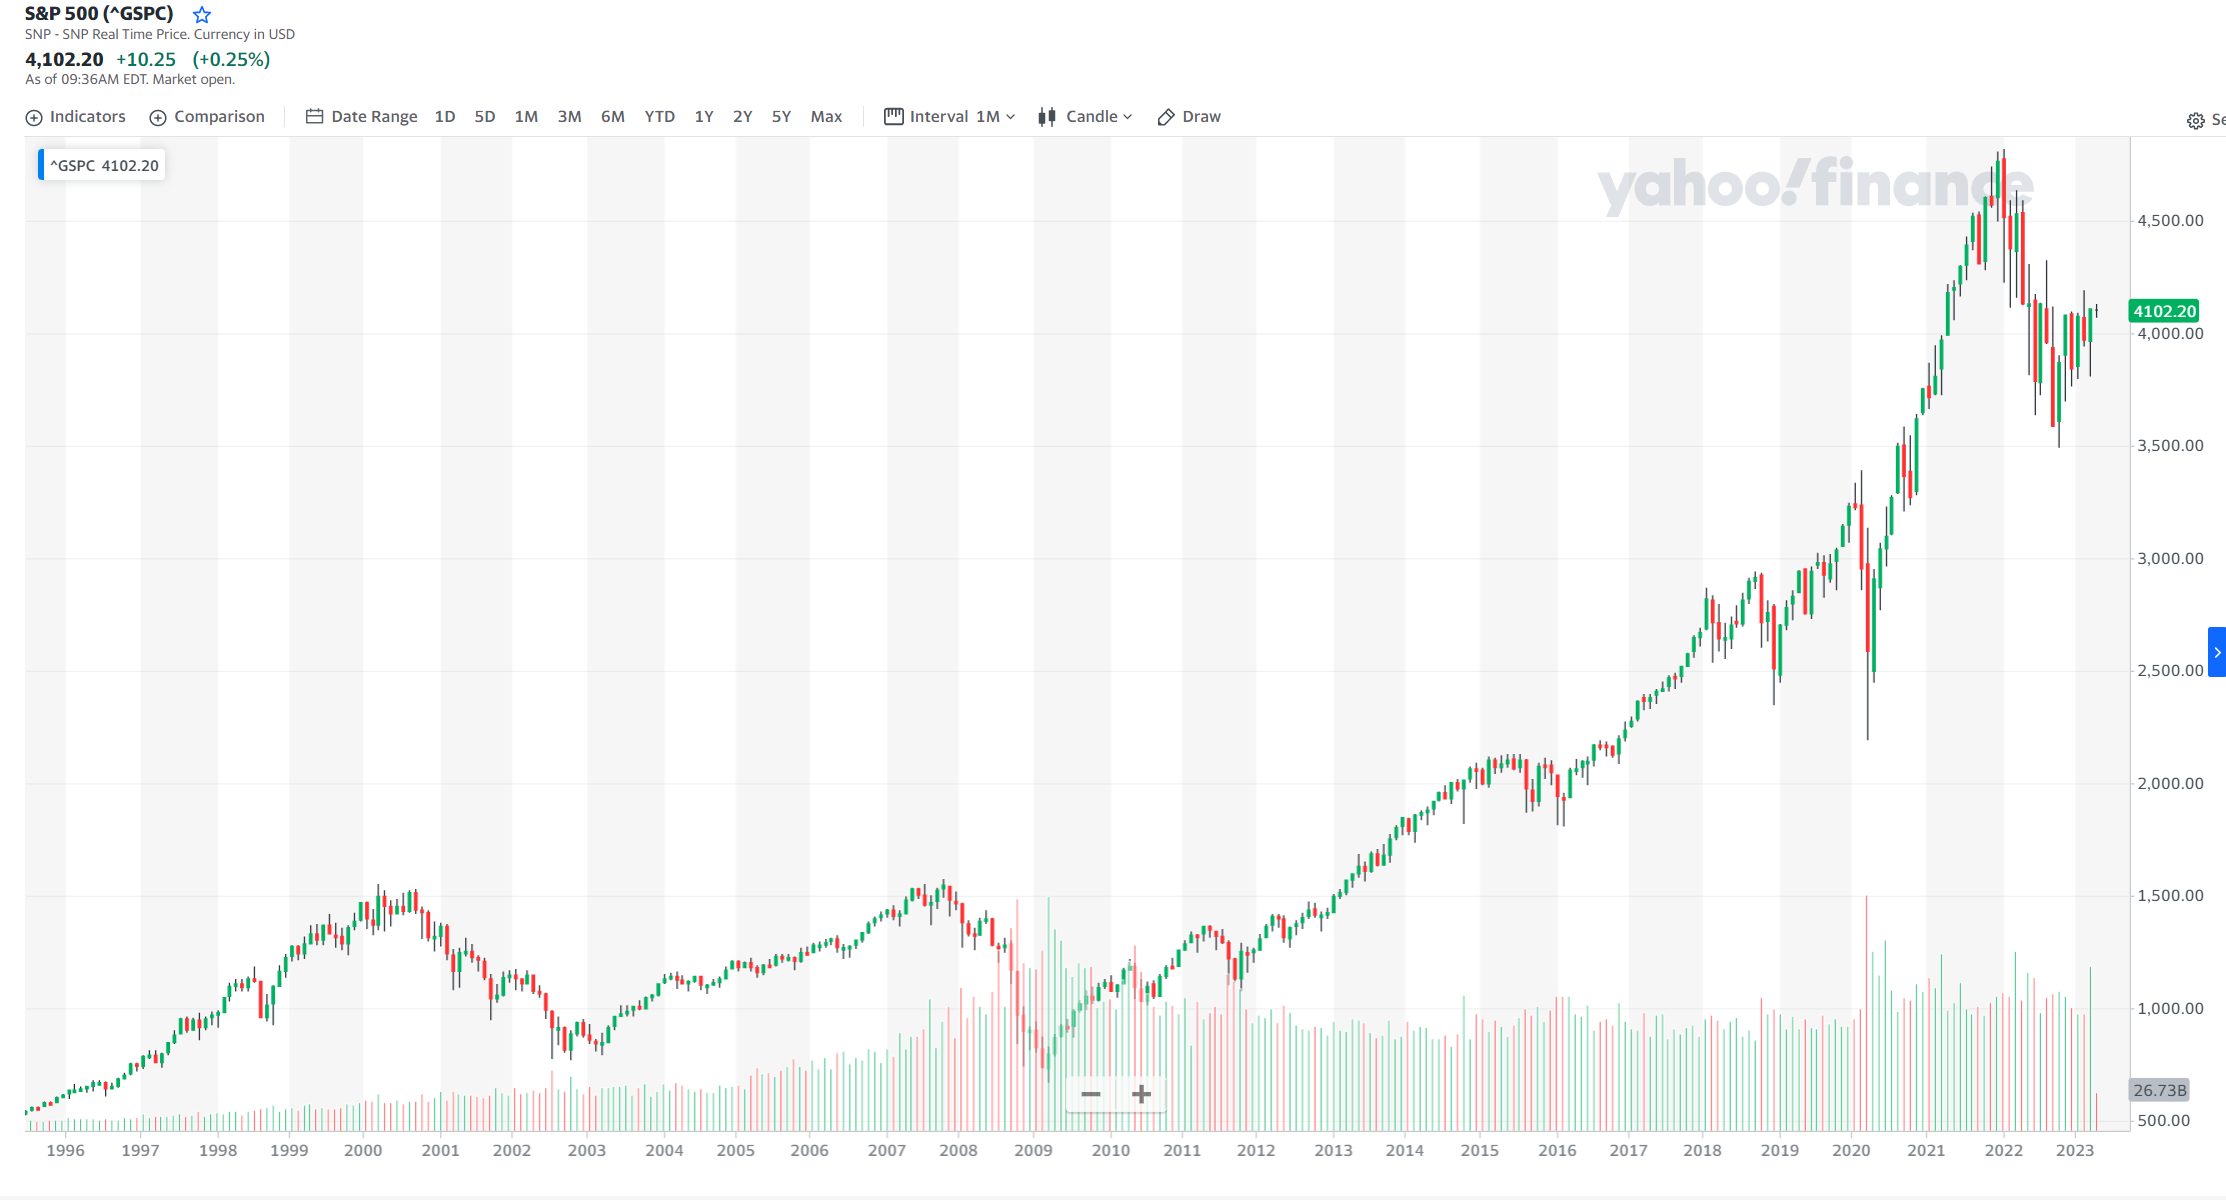
As you can see, VIX is USUALLY a good sentiment indicator, except for one notable period from 1996 to 2000. For this period, VIX went up from 10 to 25 while S&P500 went from 560 to 1,450 (a return of 160%!). What could possibly explain that?
VIX is a measure of market volatility. Usually, as the prevailing wisdom suggests, volatility means downside moves. However, sometimes markets panic on the upside — what is called BUYERS PANIC. Thus, above-normal volatility can occur in a rising market as well. Furthermore, as investors in Japanese stocks can ascertain, down moves are usually fast, but NOT always. The first stages of down moves tend to be volatile, but a PROTRACTED bear market can occur while market volatility is NOT elevated (see Nikkei 225).
So, what is good market sentiment? Warren Buffett says it best: ’Conduct your affairs opposite to how others do.’ In our opinion, he means consumer sentiment. Let’s put those graphs — S&P500 and University of Michigan Consumer Sentiment, side by side.
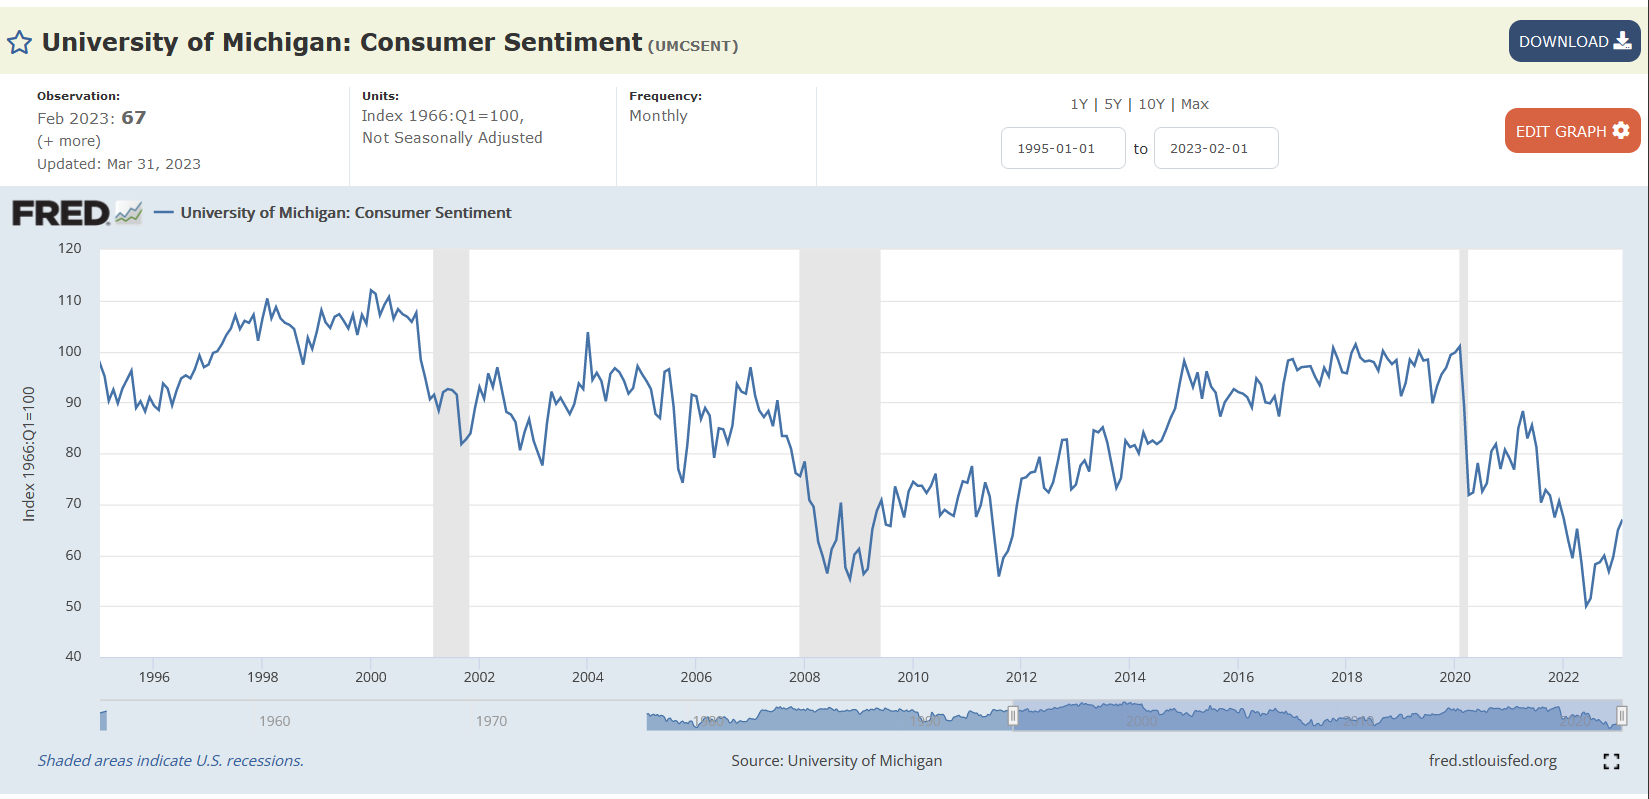
As you can see, an INVERSE relationship exists between consumer sentiment and future market performance. Future performance is good when consumer sentiment is low (like the new 10-year low). When consumer sentiment is high (like a 10-year high), future market performance is terrible.
And as clearly can see from the chart, the University of Michigan’s Consumer Sentiment is at a 30-year low. In our opinion, this bodes very well for the future performance of the S&P500.
Sources:
Disclaimer:
The articles, podcasts and newsletters from Alaric Securities LLC solely represent the authors’ views affiliated with the company; they do not represent the perspectives of Alaric Securities OOD or any of its subsidiaries or affiliates. They are provided solely for informative purposes and do not constitute recommendations for or against purchasing or selling any security. digital asset (such as cryptocurrency), or other assets in any account. They are neither research reports nor meant to be the foundation for any investing decisions. Any third-party information given does not represent the views of Alaric Securities OOD or any of its subsidiaries or affiliates. All investments carry risk, including the potential loss of principal and past success does not assure future success.
Stay Ahead with Alaric Securities Newsletters
Traders and investors don't need more information - they need better information. That’s what we deliver!
Step back from the daily noise. Each issue explores market trends, industry shifts, trading opportunities, and exclusive updates — learn what's shaping the markets, not just what's trending online. Ready to get the edge?