
Start every trading day with a quick, actionable snapshot of global markets, key earnings, and the biggest movers across US, Europe, and Asia. Get the insight before your first coffee is gone.
May 7, 2025 | 109
Top S&P 500 Sectors to Invest in for 2025

Nikolay Stoykov
Managing Partner at Alaric Securities

Analyzing Sector ETFs by Valuation, Growth Expectations, and Historical Returns
Back in one of our latest articles, VIX Volatility Index Term Structure Explained, we pointed out that a meaningful sign of easing market stress is when the VIX spot trades below the two front-month futures. It’s not a flawless rule, but historically, it’s been a helpful guide.
Here is how the VIX Term Structure looks today:
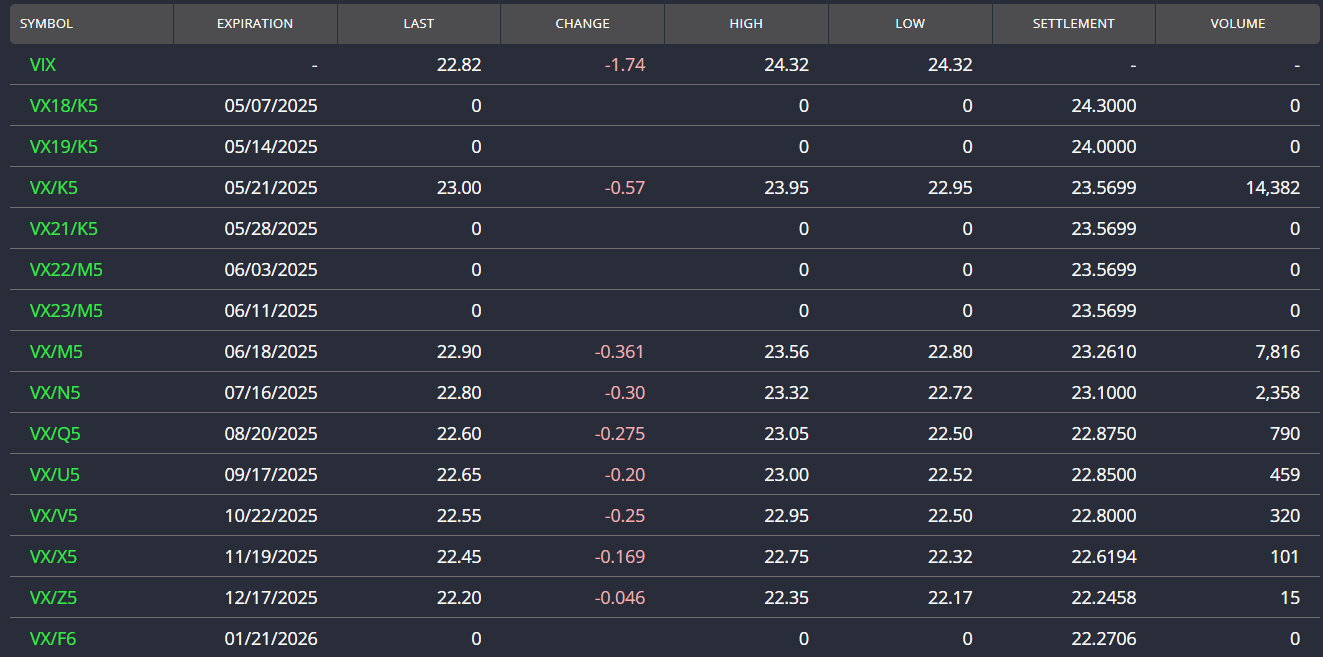
Fast forward three weeks, and that signal is now in place. While this doesn’t necessarily mean the “Tariff Wars” or other macro risks are behind us, the tone in the markets has shifted. Volatility has cooled, and investor focus is slowly returning to opportunity, namely, which S&P 500 sectors might be worth buying at this stage.
So, we went back to the data and took a fresh look at the S&P 500 sector ETFs. The goal was simple: figure out which sectors look attractive based on valuation, earnings growth, and long-term performance, and which ones don’t.
How We Derived the Data
We pulled all figures from the issuer’s website—State Street Global Advisors. The 10-year and year-to-date returns are as of May 2, 2025. We focused on forward P/E, projected earnings growth, PEG ratios, dividend yield, and historical performance to evaluate value and opportunity across the sectors.
SPY as the Benchmark
Let’s begin with SPY, which represents the broad S&P 500. As of now, SPY trades at a forward P/E of 21.2, with estimated earnings growth of 12.24%, giving it a PEG ratio of 1.74.
We consider the forward PEG ratio a helpful metric when comparing sector valuations, especially when paired with growth expectations. While it’s not the only factor in decision-making, we generally treat sectors with a lower PEG than SPY as undervalued, and those with higher PEGs as more expensive relative to expected growth.
Comparing the S&P 500 Sectors
Here’s how the 11 sector ETFs compare on key metrics:
| Name | Description | AUM in Bln | Weight in S&P500 | Forward PE | Earnings Growth | PEG Ratio | Div Yield | 10 Yr Ann. Return | YTD Return |
| SPY | 572 | 100% | 21,28 | 12,24% | 1,74 | 1,40% | 12,50% | -3,30% | |
| XLK | Technology | 66,00 | 30,32% | 25,39 | 16,14% | 1,57 | 0,82% | 18,84% | -6,80% |
| XLF | Financial | 49,00 | 14,47% | 16,74 | 11,11% | 1,51 | 1,55% | 11,93% | 3,00% |
| XLV | Health Care | 35,60 | 10,83% | 17,29 | 9,96% | 1,74 | 1,81% | 8,99% | 0,70% |
| XLY | Consumer Discretionary | 19,40 | 10,35% | 24,78 | 9,10% | 2,72 | 0,96% | 11,50% | -10,20% |
| XLC | Communications | 20,40 | 9,32% | 16,89 | 8,06% | 2,10 | 1,27% | 11,30% | 0,60% |
| XLI | Industrial | 19,30 | 8,54% | 22,44 | 11,91% | 1,88 | 1,47% | 11,06% | 2,10% |
| XLP | Consumer Staples | 15,80 | 6,16% | 20,32 | 5,91% | 3,44 | 2,65% | 4,48% | 3,80% |
| XLE | Energy | 26,40 | 3,18% | 14,91 | 9,37% | 1,59 | 3,74% | 6,19% | -4,30% |
| XLU | Utilities | 18,10 | 2,56% | 18,12 | 8,19% | 2,21 | 3,02% | 9,55% | 5,40% |
| XLRE | Real Estate | 7,40 | 2,25% | 39,61 | 10,30% | 3,85 | 3,51% | 7,22% | 3,10% |
| XLB | Material | 4,90 | 2,01% | 19,72 | 8,57% | 2,30 | 2,22% | 8,06% | 0,90% |
Identifying the Undervalued Sectors
Of the 11 sectors, three stand out as clearly cheaper than SPY: XLK, XLF, and XLE. Two more—XLV and XLI—have PEG ratios close to that of SPY. The rest trade at significantly higher PEG multiples.
That said, a high PEG doesn’t mean an ETF isn’t investable—it simply reflects a less attractive valuation relative to growth. Many of the sectors with higher PEGs also haven’t experienced the same correction SPY has seen this year, which adds a valuation premium we’re not inclined to pay right now.
We also factored in 10-year annualized returns. While growth forecasts are helpful, they’re still forecasts. Historical consistency can provide an additional layer of confidence.
Top Choice – XLK (Technology)
The XLK ETF, tracking the technology sector, comes out on top. It has a PEG ratio of 1.57, about 10% below SPY, and has undergone a deeper YTD correction, down 6.8%—which we see as a potential buying opportunity.
XLK also boasts the highest 10-year annual return among all sectors at 18.84%. Its growth outlook remains the strongest, and historically, it’s been a “keep your winners” type of performer. While not risk-free, the combination of valuation, earnings growth, and track record makes XLK our favorite.
It’s worth noting that XLK and QQQ are often seen as interchangeable. While they’re not identical, they’re correlated closely enough that similar conclusions apply.
Alternate Choice – XLF (Financials)
The XLF ETF, representing financials, has the lowest PEG ratio in the group at 1.51, and has already posted a 3% YTD gain. Its 10-year average return is nearly 12%, second only to XLK.
So why not rank it first? Mainly because it’s already performing well in 2025. XLK, in contrast, has more room to recover. But in terms of relative valuation and earnings alignment, XLF is a very strong candidate.
Honorable Mentions – XLE, XLV, and XLI
XLE (Energy) looks inexpensive on paper, with a PEG ratio of 1.59. But when you compare that to its 10-year return of just 6.19%, the case weakens. Add in the structural risks from electric vehicle adoption and renewable energy disruption, and we think caution is warranted.
If the sector were priced meaningfully lower, we’d consider it—but right now, it’s priced similarly to XLK and XLF, which come with fewer long-term uncertainties.
XLV (Health Care) and XLI (Industrials) have PEG ratios roughly in line with SPY, with solid but not outstanding return profiles. Both have their place in a balanced portfolio, but from a valuation-growth standpoint, they don’t quite rise to the top.
S&P 500 Sectors We’re Avoiding for Now
ETFs like XLY, XLC, XLP, XLU, XLRE, and XLB all trade at PEGs significantly above SPY’s 1.74. That doesn’t mean they’re “bad” investments—but given that many of them have not corrected meaningfully in 2025, we don’t see enough value at current levels to include them in our core considerations.
Conclusion
Looking across valuation, earnings expectations, and long-term returns, XLK and XLF are our top picks among S&P 500 sectors in 2025.
XLK stands out for its combination of discounted valuation, strong growth forecasts, and market leadership over the past decade. XLF, while already up on the year, is compelling as a relative value play with earnings strength behind it.
Other sectors, like XLV and XLI, may suit investors looking for lower volatility or more cyclical exposure. XLE, while undervalued on PEG alone, carries risks that we believe justify a more conservative stance.
In our view, technology and financials offer the most attractive mix of upside and valuation in today’s market.
Disclaimer
The articles, podcasts, and newsletters from Alaric Securities OOD solely represent the authors’ views affiliated with the company. They do not mean the perspectives of Alaric Securities OOD or any of its subsidiaries or affiliates. They are provided for informative purposes and do not constitute recommendations for or against purchasing or selling securities. Digital assets (such as cryptocurrency) or other assets in any account. They are neither research reports nor meant to be the foundation for any investing decisions. Any third-party information given does not represent the views of Alaric Securities OOD or any of its subsidiaries or affiliates. All investments carry risk, including the potential loss of principal, and past success does not assure future success.
Stay Ahead with Alaric Securities Newsletters
Traders and investors don't need more information - they need better information. That’s what we deliver!
Step back from the daily noise. Each issue explores market trends, industry shifts, trading opportunities, and exclusive updates — learn what's shaping the markets, not just what's trending online. Ready to get the edge?