
Inflation 2023 and Beyond: Projections and Insights


Interest rates and inflation have been on most market participants’ minds for nearly two years now. Inflation 2023, in the words of Fed’s Chairman Powell, was expected to be transitory.
It turned out it was not.
With interest rates at a record 20-year high and inflation finally subsiding and below the levels of short-term rates, the talk has shifted to the potential for a return of inflation in the future.
Historical perspective on inflation
Before answering this question, we need to go back to history. Monetary policy, the way most central banks currently conduct it, is relatively new. Before 1970, central bank policies were highly inflexible, with most countries adhering to the gold standard.
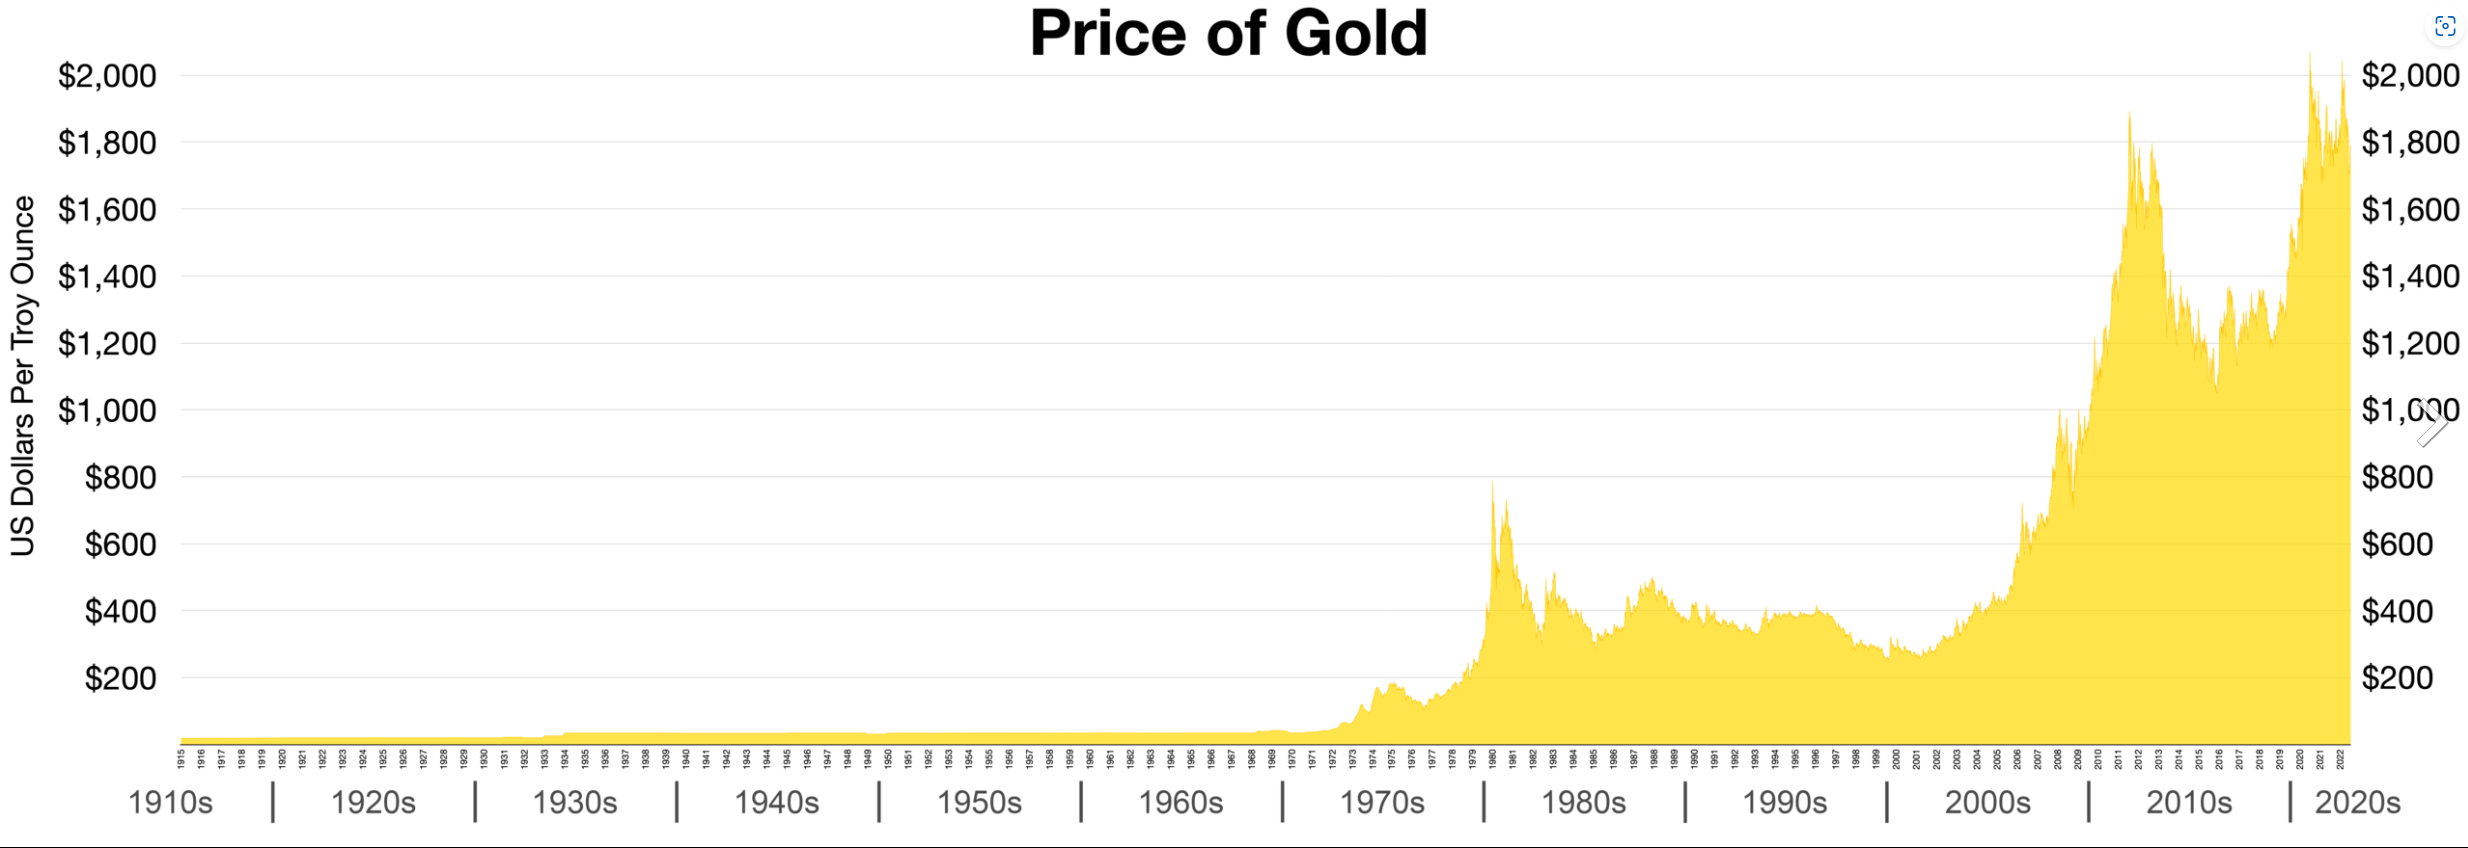
That does not mean that before 1970 there was no inflation – even though the price of gold was fixed, there were periods of inflation but also periods of deflation. Those periods of deflation turned out to be highly destructive.
In the late 1960s, most advanced economies agreed to abandon the gold standard and start the present fiat money monetary policy – most major currencies are not backed by gold (or any other physical asset like silver).
Milton Friedman’s Significant Contributions
It’s important to acknowledge that Professor Milton Friedman was awarded the Nobel Prize in Economics in 1976 for his significant contributions to modern monetary theory. His work is widely accepted on the subject and was effectively applied by Chairman Bernanke during the handling of the Global Financial Crisis in 2008-2009.
While we encourage our readers to explore the work of Prof Friedman on their own, the essence of his theory is that expected inflation is the excess of money supply relative to GDP.
Here is how we would describe it:
Money Supply = Money in Circulation X Annual Velocity of Money
Expected Inflation = (Money Supply – Nominal Annual GDP)/Nominal Annual GDP
Revisiting the predictions for inflation 2023
In November 2022, we explored this subject in our article titled US inflation at 1.3% in 2023? Is the Fed wrong again? Let’s reevaluate those predictions with updated data as of March 2023:
Table 1: Change in CPI for the period 2002-2023, GDP and M2 supply
| Year | Total M2 Supply | GDP | MS as % GDP | Predicted Inflation | CPI Change |
| 2002 | 11123 | 10936 | 101,7% | N/A | 1,59% |
| 2003 | 11771 | 11458 | 102,7% | 1,7% | 2,27% |
| 2004 | 12567 | 12214 | 102,9% | 2,7% | 2,68% |
| 2005 | 13370 | 13037 | 102,6% | 2,9% | 3,39% |
| 2006 | 14122 | 13815 | 102,2% | 2,6% | 3,23% |
| 2007 | 14771 | 14452 | 102,2% | 2,2% | 2,85% |
| 2008 | 14852 | 14713 | 100,9% | 2,2% | 3,84% |
| 2009 | 14664 | 14449 | 101,5% | 0,9% | 0,36% |
| 2010 | 15359 | 14992 | 102,4% | 1,5% | 1,64% |
| 2011 | 15920 | 15543 | 102,4% | 2,4% | 3,16% |
| 2012 | 16589 | 16197 | 102,4% | 2,4% | 2,07% |
| 2013 | 17205 | 16785 | 102,5% | 2,4% | 1,46% |
| 2014 | 17954 | 17527 | 102,4% | 2,5% | 1,62% |
| 2015 | 18430 | 18238 | 101,1% | 2,4% | 0,12% |
| 2016 | 19035 | 18745 | 101,5% | 1,1% | 1,26% |
| 2017 | 19947 | 19543 | 102,1% | 1,5% | 2,13% |
| 2018 | 20935 | 20612 | 101,6% | 2,1% | 2,44% |
| 2019 | 21830 | 21433 | 101,9% | 1,6% | 1,81% |
| 2020 | 21917 | 21704 | 101,0% | 1,9% | 1,23% |
| 2021 | 24542 | 22996 | 106,70% | 0,98% | 4,70% |
| 2022 | 25894 | 25462 | 101,7% | 6,7% | 6,45% |
| 2023* | 26195 | 26529 | 98,74% | 1,70% | 1,70%* |
*Non-annualized as of the end of March 2023
Again, let’s be sure that you read this table correctly – in 2002, the total M2 money supply was 11123 Bln USD while GDP was 10936 Bln USD. So, that year’s total M2 Supply was 101,7% of the GDP.
Therefore in 2023, the model would have predicted inflation of 1,7% while the actual inflation, as measured by the CPI change, was 2,27%.
The numbers for 2022 differ slightly from our article from November 2022, as the GDP estimate for the year was adjusted down. With the final 2022 numbers that were unknown at the time, the model would have predicted 1,7% annual inflation – a bit higher than our original estimate of 1,3% but not that much higher.
Let’s now use the same model, but instead of annual numbers, use quarterly numbers.
Table 2: Change in CPI for the period 2017-2023
| Year | Quarter | Predicted Inflation | Change in PPI-All Commodities | Change in CPI |
| 2017 | Q1 | 0,35% | 0,42% | 0,58% |
| Q2 | 0,51% | 1,10% | 0,87% | |
| Q3 | 0,23% | 0,62% | 0,76% | |
| Q4 | 0,39% | 0,77% | -0,12% | |
| 2018 | Q1 | 0,27% | 1,53% | 1,23% |
| Q2 | 0,40% | 2,46% | 0,98% | |
| Q3 | 0,45% | -0,29% | 0,18% | |
| Q4 | 0,25% | -1,28% | -0,48% | |
| 2019 | Q1 | 0,56% | -0,10% | 1,18% |
| Q2 | 0,55% | -0,25% | 0,76% | |
| Q3 | 0,63% | -0,95% | 0,16% | |
| Q4 | 0,23% | 0,30% | 0,16% | |
| 2020 | Q1 | -2,15% | -2,96% | 0,44% |
| Q2 | -12,22% | -0,98% | -0,12% | |
| Q3 | 8,07% | 2,25% | 0,96% | |
| Q4 | 0,51% | 2,56% | 0,07% | |
| 2021 | Q1 | 1,57% | 7,23% | 1,69% |
| Q2 | 2,21% | 6,47% | 2,57% | |
| Q3 | 1,26% | 2,96% | 0,96% | |
| Q4 | 2,53% | 2,40% | 1,64% | |
| 2022 | Q1 | 1,36% | 7,74% | 3,12% |
| Q2 | 0,50% | 7,78% | 3,06% | |
| Q3 | 0,15% | -4,41% | 0,17% | |
| Q4 | -0,44% | -3,73% | 0,00% | |
| 2023 | Q1 | -0,90% | -0,33% | 1,70% |
| Q2 | -1,02% | -1,30% | 1,08% |
*The prices above are actual changes for the period, not annualized changes.
Predictions and actual inflation in 2023
Predictions and actual inflation 2023 are presented in the table above, utilizing data from 2017. Notably, the numbers from 2017 to 2019 encompass the entire decade from 2010 to 2020. On a quarterly basis, CPI changes averaged around 0.25%-0.50%, resulting in an annual inflation range of 1-2%. While PPI-All Commodities exhibited higher volatility, predicted inflation aligned closely with actual CPI inflation.
Examining the table, it becomes apparent where inflation is coming from. In 2021, the Fed made a mistake by implementing a fixed amount of Quantitative Easing of 100 BLN USD per month. In hindsight, this fixed approach should have been adjusted based on changes in the velocity of money and the actual GDP growth rate.
Since the middle of 2022, the Fed’s monetary policy has taken an opposite direction, adopting a notably deflationary stance. Though this restrictive policy hasn’t yet translated into deflation as measured by the CPI, it has led to lower PPI-All Commodity Index readings. With sufficient time, we expect CPI changes to more closely align with the predicted inflation readings.
The future outlook for inflation 2023
In conclusion, considering the future outlook for inflation 2023, it is evident that the US has experienced inflation due to a combination of factors. Chief among them was the too-loose monetary policy of the Fed in 2021.
Additionally, exogenous adverse shocks, like COVID-19 and the war in Ukraine, significantly impacted the prices of goods and services, both directly and indirectly.
At present, the current monetary policy of the Fed remains highly restrictive, bordering on a deflationary approach, leading to a probable scenario of CPI annual changes returning to the targeted level of 2% per annum.
In our opinion, the possibility of periods of elevated inflation above 2% in the future would only materialize with another exogenous shock to the US economy – a situation comparable to a war in Taiwan. Nonetheless, we consider this theoretical possibility to be improbable.