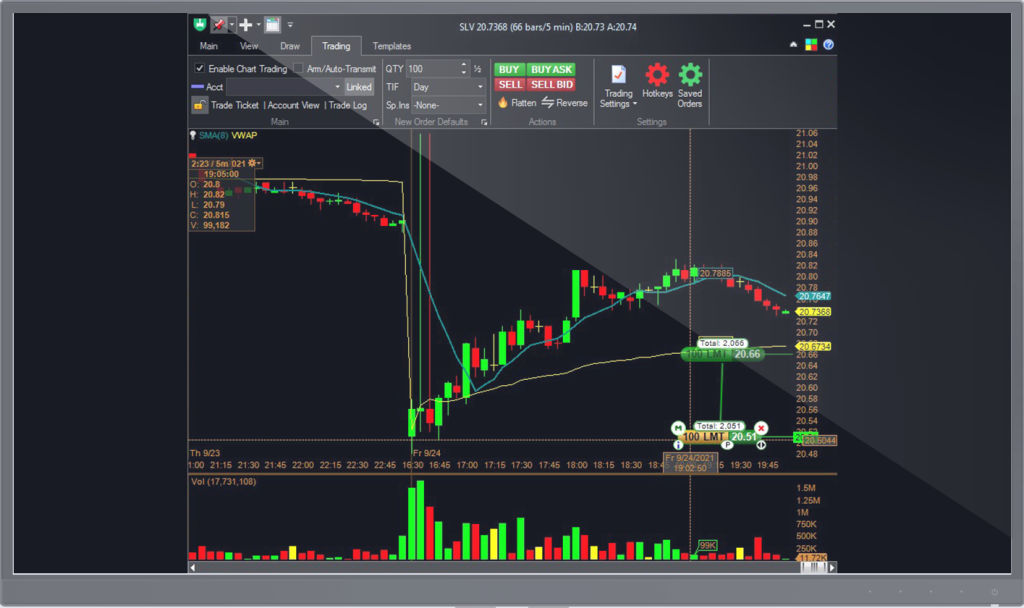
Intuitive and convenient control over positions and new and pending orders – all from the chart
Enabling CHART TRADING gives you multiple features:
Arm/Auto Transmit any order that is created on the chart without confirmation – the order get immediately placed.
Pick a trading account to use when trading from this chart if you are using more than one account.
New Trade Ticket, Account View or Trade Log
Select Quantity, Time in Force parameter , Special instrucions and Exchange
Actions – Buy, Sell, Buy Ask and Sell Bid, which allow you to place an order on the chart
Show Positions of the ticker that is charted
“Flatten” button – Close out the position immediately
“Reverse the position” Button – If originally Long, sell and open a short position
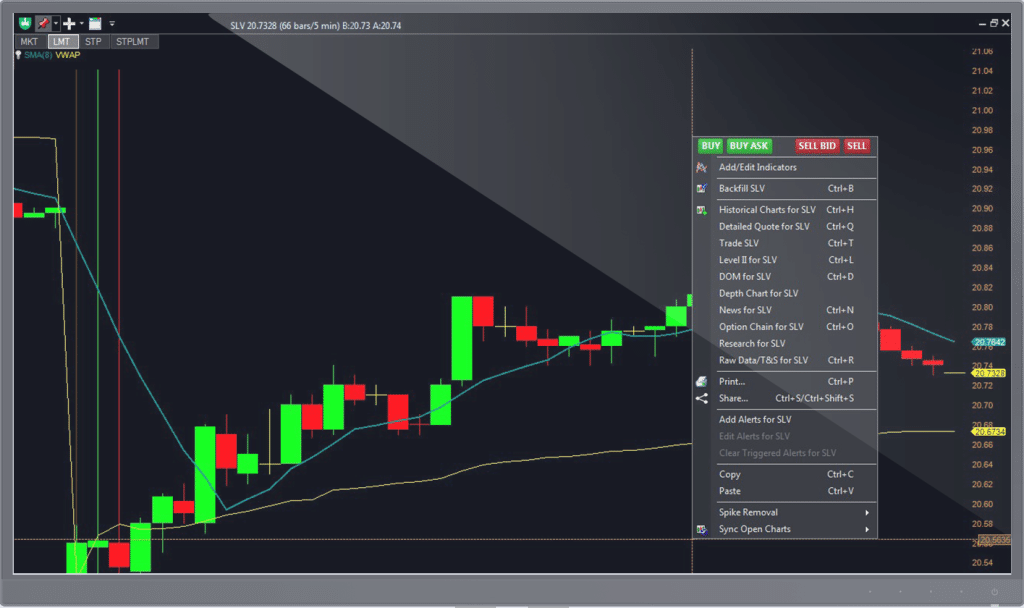
Placing a Trade
Buy Ask and Sell Bid buttons, when clicked, will create a buy or sell limit order at the current Ask or Bid for a ticker.
The Buy and Sell buttons will allow you to place a Buy Limit or Sell Limit order on the chart.
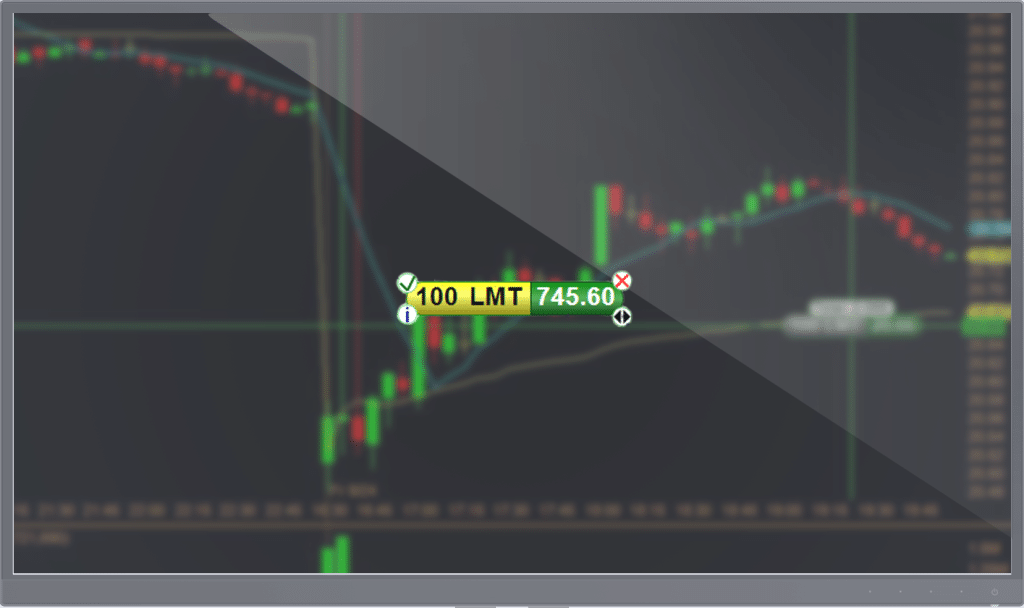
The Trading capsule
The trading capsule gives you all the information about the order and while moving it on the chart it gives you all the means to manipulate it:
Capsule’s Color – green for BUY orders and red for SELL orders
Order Type – Limit, Stop or Stop-Limit
Quantity
Price
Transmit – the order is not sent to the broker until you press it
Cancel
Filled order info
You can drag the Trading capsule and drop it at the chart at the price you’d like.
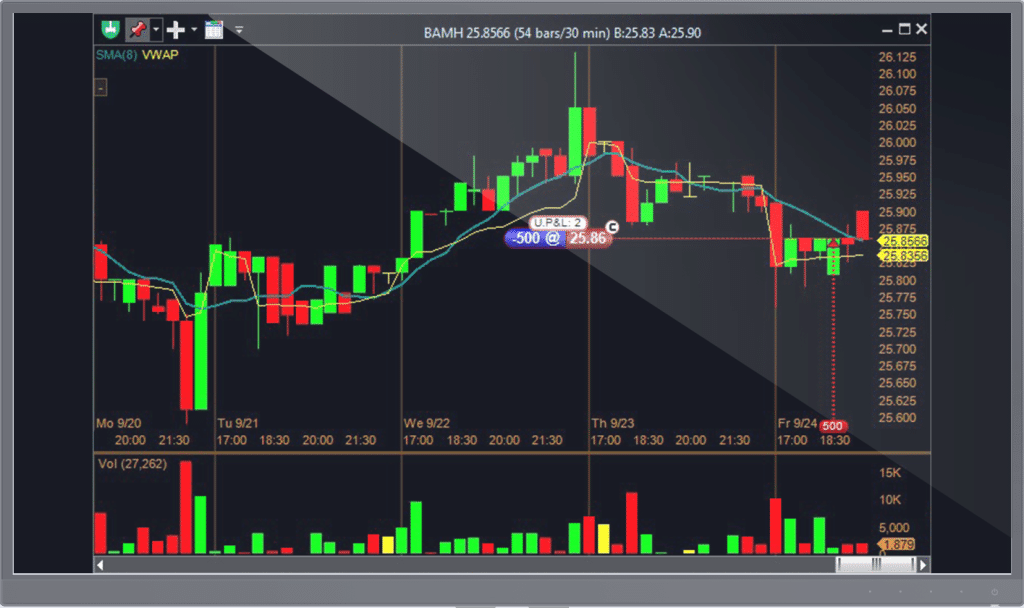
Showing Open Positions on Charts
The Position Capsule shows the quantity in the left half blue. The right part’s color is green for long positions and red for short positions. There is only one button on the capsule – the Close button. Pressing it will initiate placing a Limit order that would close the position.
There is an option Adjust Scale/Pos to make visible all positions on the chart even if they are deep in the money or out of the money.
Modifying the order
Any order that is open and visible on the chart can be modified – change the price as per the capsule’s vertical position; change the quantity of the open order.
There is an option Adjust Scale/Trans to make visible all orders on the chart even if they are not close to the current price.
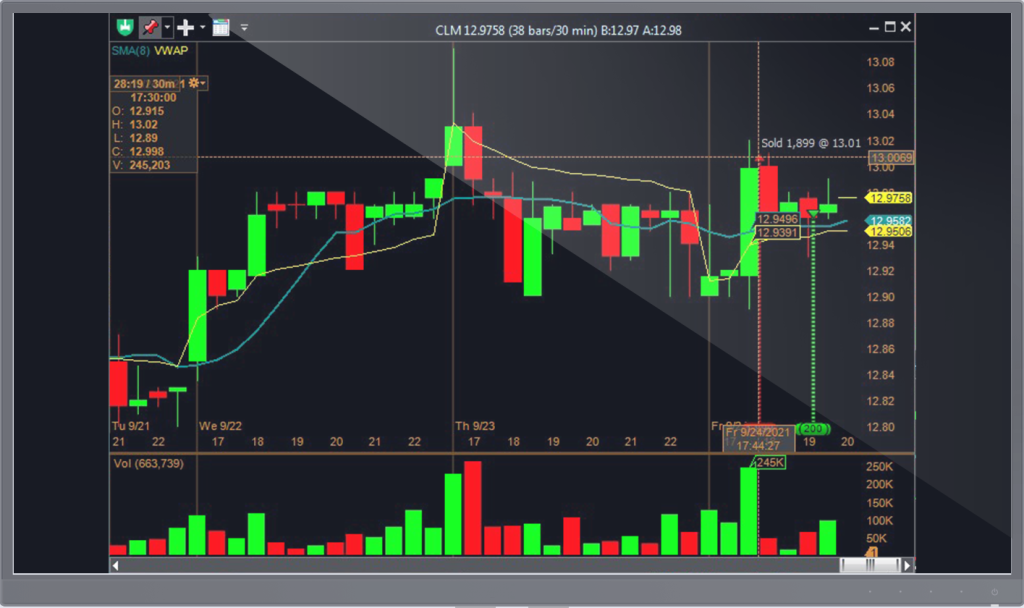
Showing Filled Transactions on Charts
The chart can also show the transactions executed during the current session on the chart if the setting is selected on the Trading tab of the ribbon menu.
Each transaction is shown as a colored triangle at the time and price at which it was executed. Upward triangle is opening a position while downward one is closing it. Green color indicates a buy, and red color – a sell. Placing the mouse on the colored triangle will show the execution details.